OPEN-SOURCE SCRIPT
Fisher Volume Transform | AlphaNatt
Fisher Volume Transform | AlphaNatt
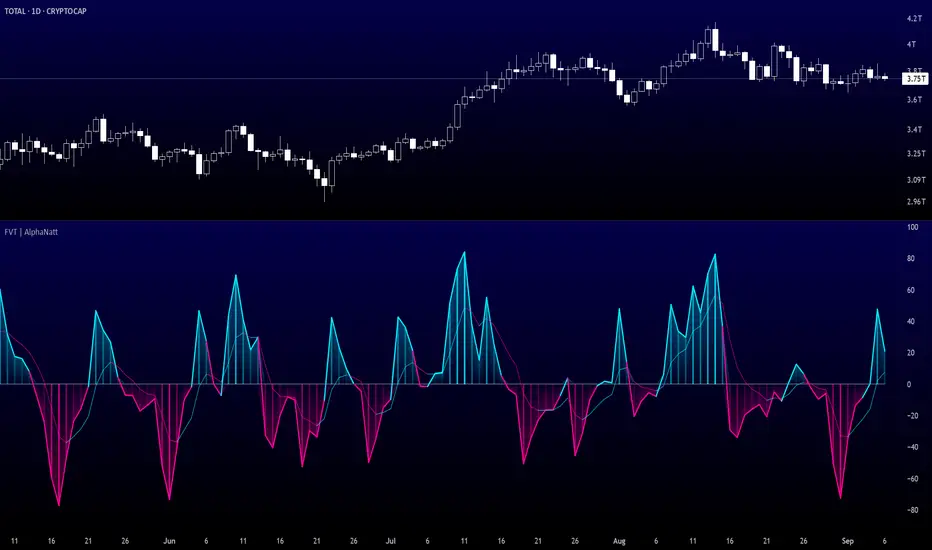
A powerful oscillator that applies the Fisher Transform - converting price into a Gaussian normal distribution - while incorporating volume weighting to identify high-probability reversal points with institutional participation.
━━━━━━━━━━━━━━━━━━━━━━━━━━━━━━━━━━━━━━━━
🎲 THE MATHEMATICS
Fisher Transform Formula:
The Fisher Transform converts any bounded dataset into a Gaussian distribution:
Where x is normalized price (-1 to 1 range)
Why This Matters:
Volume Integration:
Unlike standard Fisher Transform, this version weights price by relative volume:
━━━━━━━━━━━━━━━━━━━━━━━━━━━━━━━━━━━━━━━━
💎 KEY ADVANTAGES
━━━━━━━━━━━━━━━━━━━━━━━━━━━━━━━━━━━━━━━━
⚙️ SETTINGS OPTIMIZATION
Fisher Period (5-30):
Volume Weight (0.1-1.0):
━━━━━━━━━━━━━━━━━━━━━━━━━━━━━━━━━━━━━━━━
📊 TRADING SIGNALS
Primary Signals:
Visual Interpretation:
━━━━━━━━━━━━━━━━━━━━━━━━━━━━━━━━━━━━━━━━
🎯 OPTIMAL USAGE
Best Market Conditions:
Trading Strategies:
1. Extreme Reversal:
Enter when oscillator exceeds ±75 and reverses
2. Zero Line Momentum:
Trade crosses of zero line with volume confirmation
3. Signal Line Strategy:
Early entry on signal line crosses
4. Divergence Trading:
Price makes new high/low but Fisher doesn't
━━━━━━━━━━━━━━━━━━━━━━━━━━━━━━━━━━━━━━━━
Developed by AlphaNatt | Quantitative Trading Systems
Version: 1.0
Classification: Statistical Transform Oscillator
Not financial advice. Always DYOR.
A powerful oscillator that applies the Fisher Transform - converting price into a Gaussian normal distribution - while incorporating volume weighting to identify high-probability reversal points with institutional participation.
"The Fisher Transform reveals what statistics professors have known for decades: when you transform market data into a normal distribution, turning points become crystal clear."
━━━━━━━━━━━━━━━━━━━━━━━━━━━━━━━━━━━━━━━━
🎲 THE MATHEMATICS
Fisher Transform Formula:
The Fisher Transform converts any bounded dataset into a Gaussian distribution:
y = 0.5 × ln((1 + x) / (1 - x))
Where x is normalized price (-1 to 1 range)
Why This Matters:
- Market extremes become statistically identifiable
- Turning points are amplified and clarified
- Removes the skew from price distributions
- Creates nearly instantaneous signals at reversals
Volume Integration:
Unlike standard Fisher Transform, this version weights price by relative volume:
- High volume moves get more weight
- Low volume moves get filtered out
- Identifies institutional participation
- Reduces false signals from retail chop
━━━━━━━━━━━━━━━━━━━━━━━━━━━━━━━━━━━━━━━━
💎 KEY ADVANTAGES
- Statistical Edge: Transforms price into normal distribution where extremes are mathematically defined
- Volume Confirmation: Only signals with volume support
- Early Reversal Detection: Fisher Transform amplifies turning points
- Clean Signals: Gaussian distribution reduces noise
- No Lag: Mathematical transformation, not averaging
━━━━━━━━━━━━━━━━━━━━━━━━━━━━━━━━━━━━━━━━
⚙️ SETTINGS OPTIMIZATION
Fisher Period (5-30):
- 5-9: Very sensitive, many signals
- 10: Default - balanced sensitivity
- 15-20: Moderate smoothing
- 25-30: Major reversals only
Volume Weight (0.1-1.0):
- 0.1-0.3: Minimal volume influence
- 0.5-0.7: Balanced price/volume
- 0.7: Default - strong volume weight
- 0.8-1.0: Volume dominant
━━━━━━━━━━━━━━━━━━━━━━━━━━━━━━━━━━━━━━━━
📊 TRADING SIGNALS
Primary Signals:
- Zero Cross Up: Bullish momentum shift
- Zero Cross Down: Bearish momentum shift
- Signal Line Cross: Early reversal warning
- Extreme Readings (±75): Potential reversal zones
Visual Interpretation:
- Cyan zones: Bullish momentum
- Magenta zones: Bearish momentum
- Gradient intensity: Strength of move
- Histogram: Raw momentum power
━━━━━━━━━━━━━━━━━━━━━━━━━━━━━━━━━━━━━━━━
🎯 OPTIMAL USAGE
Best Market Conditions:
- Range-bound markets (reversals clear)
- High volume periods
- Major support/resistance levels
- Divergence hunting
Trading Strategies:
1. Extreme Reversal:
Enter when oscillator exceeds ±75 and reverses
2. Zero Line Momentum:
Trade crosses of zero line with volume confirmation
3. Signal Line Strategy:
Early entry on signal line crosses
4. Divergence Trading:
Price makes new high/low but Fisher doesn't
━━━━━━━━━━━━━━━━━━━━━━━━━━━━━━━━━━━━━━━━
Developed by AlphaNatt | Quantitative Trading Systems
Version: 1.0
Classification: Statistical Transform Oscillator
Not financial advice. Always DYOR.
نص برمجي مفتوح المصدر
بروح TradingView الحقيقية، قام مبتكر هذا النص البرمجي بجعله مفتوح المصدر، بحيث يمكن للمتداولين مراجعة وظائفه والتحقق منها. شكرا للمؤلف! بينما يمكنك استخدامه مجانًا، تذكر أن إعادة نشر الكود يخضع لقواعد الموقع الخاصة بنا.
Free Analysis Platform 👉 alphanatt.com
إخلاء المسؤولية
لا يُقصد بالمعلومات والمنشورات أن تكون، أو تشكل، أي نصيحة مالية أو استثمارية أو تجارية أو أنواع أخرى من النصائح أو التوصيات المقدمة أو المعتمدة من TradingView. اقرأ المزيد في شروط الاستخدام.