OPEN-SOURCE SCRIPT
Relative Strength 3D Indicator [CC]
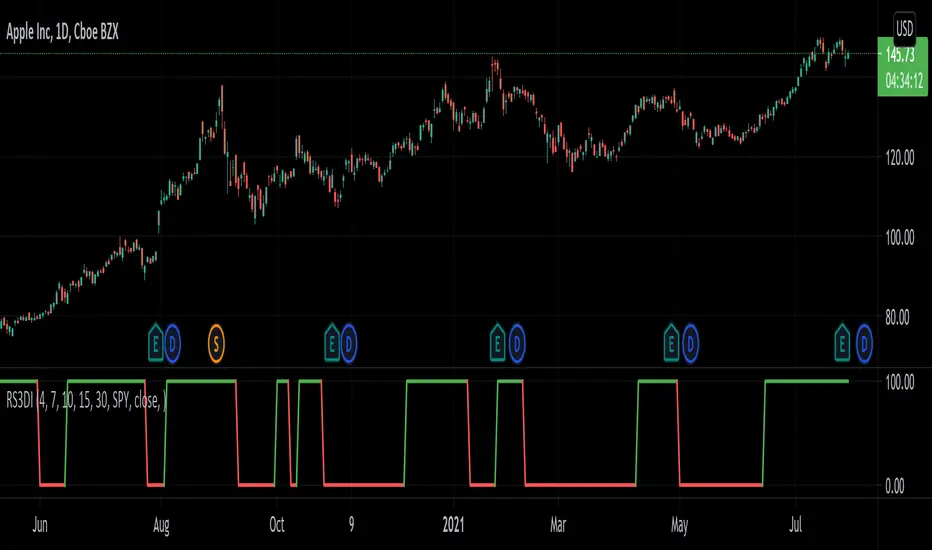
This is a custom indicator of mine loosely based on the work by James Garofallou (Stocks and Commodities Sep 2020 pg 14) and this is meant for medium to long term trend confirmations. The idea behind this indicator is to capture 3 different dimensions of trend strength. The first dimension captures the overall strength of the underlying stock vs the market (in this case the S&P 500). The second dimension captures the overall trend strength by assigning a scoring system so when all faster moving averages are stronger than slower moving averages then it gets the max points. The final dimension is the strength of the overall strength of everything so far. Buy when the indicator line turns green and sell when it turns red.
Let me know if there are any other indicators or scripts you would like to see me publish!
Let me know if there are any other indicators or scripts you would like to see me publish!
نص برمجي مفتوح المصدر
بروح TradingView الحقيقية، قام مبتكر هذا النص البرمجي بجعله مفتوح المصدر، بحيث يمكن للمتداولين مراجعة وظائفه والتحقق منها. شكرا للمؤلف! بينما يمكنك استخدامه مجانًا، تذكر أن إعادة نشر الكود يخضع لقواعد الموقع الخاصة بنا.
إخلاء المسؤولية
لا يُقصد بالمعلومات والمنشورات أن تكون، أو تشكل، أي نصيحة مالية أو استثمارية أو تجارية أو أنواع أخرى من النصائح أو التوصيات المقدمة أو المعتمدة من TradingView. اقرأ المزيد في شروط الاستخدام.