OPEN-SOURCE SCRIPT
تم تحديثه kou_di
The Simple Moving Average (SMA) is the most basic and widely used type of moving average. It’s calculated by taking the arithmetic mean of a given set of prices or data points over a specified period.
SMA = (P1 + P2 + ... + Pn) /n
Where
P1, P2, ... , Pn = prices of data points
n = number of periods
When a new SMA is calculated for a new candle stick, the oldest data point P1 is removed from the original data points (P1 + P2 + ... + Pn) and a new price Pn+1 is added to form a new SMA:
SMA_new = (P2 + ... + Pn + Pn+1) /n
If Pn+1 < P1, SMA line will become downward trend, or if Pn+1 > P1, SMA line will become upward trend. This logic help us predict the moving direction of SMA line which will form the prices trend in the future.
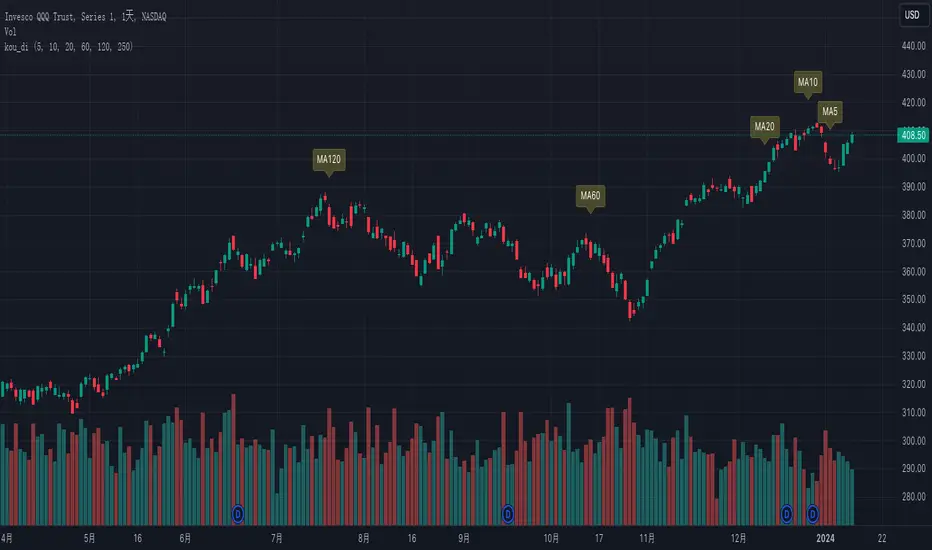
So it's important to highlight the "P1" candle stick for SMAs of different periods to help us predict the trend of SMA lines.
Since SMA5, SMA10, SMA20, SMA60, SMA120, SMA250 are the most popular SMAs, this indicator marks the "P1" candle stick for all of them by default, but you can optionally disable them.
该指标用于显示SMA5, SMA10, SMA20, SMA60, SMA120, SMA250 的扣抵位来监测均线拐点的出现
SMA = (P1 + P2 + ... + Pn) /n
Where
P1, P2, ... , Pn = prices of data points
n = number of periods
When a new SMA is calculated for a new candle stick, the oldest data point P1 is removed from the original data points (P1 + P2 + ... + Pn) and a new price Pn+1 is added to form a new SMA:
SMA_new = (P2 + ... + Pn + Pn+1) /n
If Pn+1 < P1, SMA line will become downward trend, or if Pn+1 > P1, SMA line will become upward trend. This logic help us predict the moving direction of SMA line which will form the prices trend in the future.
So it's important to highlight the "P1" candle stick for SMAs of different periods to help us predict the trend of SMA lines.
Since SMA5, SMA10, SMA20, SMA60, SMA120, SMA250 are the most popular SMAs, this indicator marks the "P1" candle stick for all of them by default, but you can optionally disable them.
该指标用于显示SMA5, SMA10, SMA20, SMA60, SMA120, SMA250 的扣抵位来监测均线拐点的出现
ملاحظات الأخبار
Fix a bugملاحظات الأخبار
Update the display of labelsملاحظات الأخبار
Addressed comment - Allow changing the color of label and label textنص برمجي مفتوح المصدر
بروح TradingView الحقيقية، قام مبتكر هذا النص البرمجي بجعله مفتوح المصدر، بحيث يمكن للمتداولين مراجعة وظائفه والتحقق منها. شكرا للمؤلف! بينما يمكنك استخدامه مجانًا، تذكر أن إعادة نشر الكود يخضع لقواعد الموقع الخاصة بنا.
إخلاء المسؤولية
لا يُقصد بالمعلومات والمنشورات أن تكون، أو تشكل، أي نصيحة مالية أو استثمارية أو تجارية أو أنواع أخرى من النصائح أو التوصيات المقدمة أو المعتمدة من TradingView. اقرأ المزيد في شروط الاستخدام.
نص برمجي مفتوح المصدر
بروح TradingView الحقيقية، قام مبتكر هذا النص البرمجي بجعله مفتوح المصدر، بحيث يمكن للمتداولين مراجعة وظائفه والتحقق منها. شكرا للمؤلف! بينما يمكنك استخدامه مجانًا، تذكر أن إعادة نشر الكود يخضع لقواعد الموقع الخاصة بنا.
إخلاء المسؤولية
لا يُقصد بالمعلومات والمنشورات أن تكون، أو تشكل، أي نصيحة مالية أو استثمارية أو تجارية أو أنواع أخرى من النصائح أو التوصيات المقدمة أو المعتمدة من TradingView. اقرأ المزيد في شروط الاستخدام.