OPEN-SOURCE SCRIPT
Money Flow Index - Beasley Savage
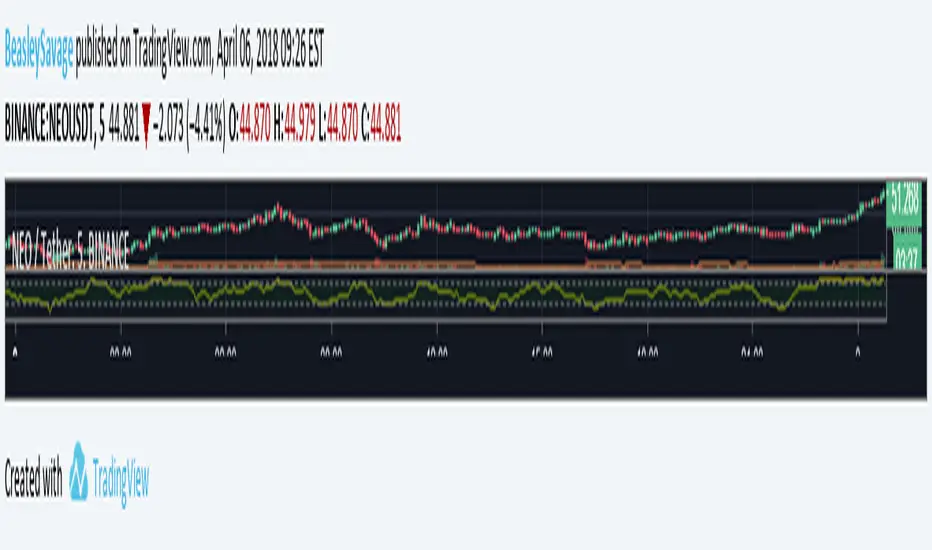
The Money Flow Index indicator (MFI) is a tool used in technical analysis for measuring buying and selling pressure. This is done through analyzing both price and volume. The MFI's calculation generates a value that is then plotted as a line that moves within a range of 0-100, making it an oscillator. When the MFI rises, this indicates an increase in buying pressure. When it falls, this indicates an increase in selling pressure. The Money Flow Index can generate several signals, most notably: overbought and oversold conditions, divergences, and failure swings.
نص برمجي مفتوح المصدر
بروح TradingView الحقيقية، قام مبتكر هذا النص البرمجي بجعله مفتوح المصدر، بحيث يمكن للمتداولين مراجعة وظائفه والتحقق منها. شكرا للمؤلف! بينما يمكنك استخدامه مجانًا، تذكر أن إعادة نشر الكود يخضع لقواعد الموقع الخاصة بنا.
إخلاء المسؤولية
لا يُقصد بالمعلومات والمنشورات أن تكون، أو تشكل، أي نصيحة مالية أو استثمارية أو تجارية أو أنواع أخرى من النصائح أو التوصيات المقدمة أو المعتمدة من TradingView. اقرأ المزيد في شروط الاستخدام.