OPEN-SOURCE SCRIPT
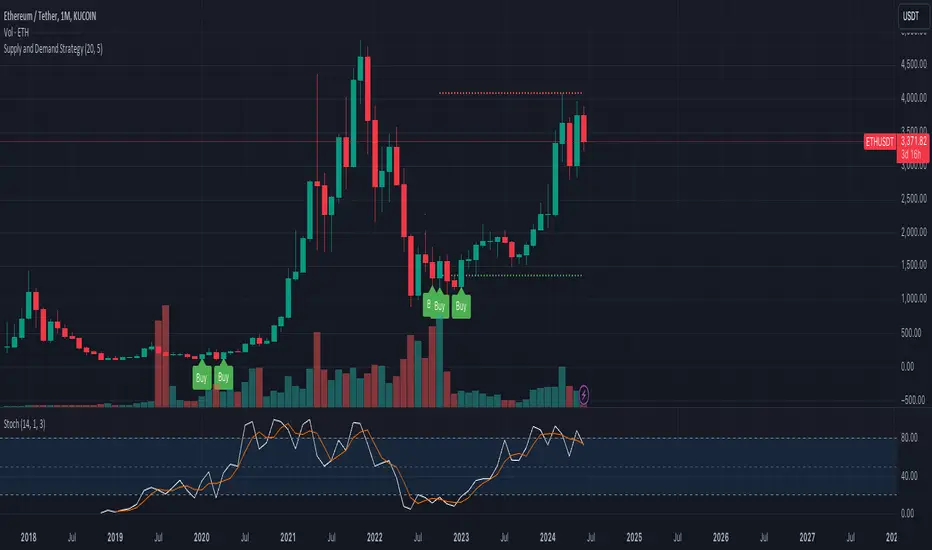
Supply and Demand Strategy

Overview
This strategy is designed to identify key supply (resistance) and demand (support) zones on a price chart. These zones represent areas where the price has historically shown a significant reaction, either bouncing up from a demand zone or dropping down from a supply zone. The strategy provides clear entry and exit points for trades based on these zones.
Key Components
Supply and Demand Zones:
Supply Zone: An area where the price has reversed from an uptrend to a downtrend. It represents a high concentration of sellers.
Demand Zone: An area where the price has reversed from a downtrend to an uptrend. It represents a high concentration of buyers.
Time Frames:
Use higher time frames (like daily or weekly) to identify key supply and demand zones.
Use lower time frames (like 1-hour or 4-hour) to pinpoint precise entry and exit points within these zones.
Confirmation:
Use price action and candlestick patterns (like pin bars or engulfing patterns) to confirm potential reversals in these zones.
نص برمجي مفتوح المصدر
بروح TradingView الحقيقية، قام مبتكر هذا النص البرمجي بجعله مفتوح المصدر، بحيث يمكن للمتداولين مراجعة وظائفه والتحقق منها. شكرا للمؤلف! بينما يمكنك استخدامه مجانًا، تذكر أن إعادة نشر الكود يخضع لقواعد الموقع الخاصة بنا.
إخلاء المسؤولية
لا يُقصد بالمعلومات والمنشورات أن تكون، أو تشكل، أي نصيحة مالية أو استثمارية أو تجارية أو أنواع أخرى من النصائح أو التوصيات المقدمة أو المعتمدة من TradingView. اقرأ المزيد في شروط الاستخدام.