OPEN-SOURCE SCRIPT
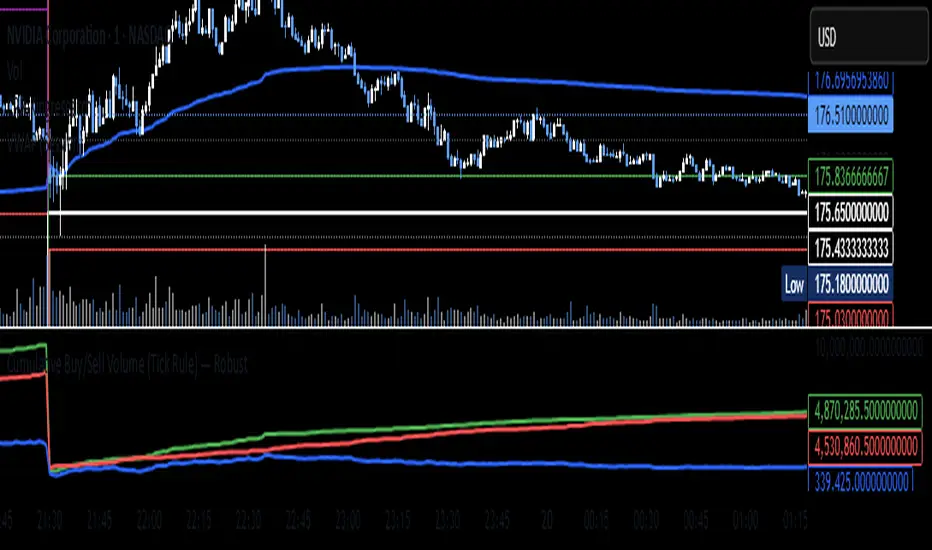
Cumulative Buy/Sell Volume (Tick Rule) — Robust
//version=5
indicator("Cumulative Buy/Sell Volume (Tick Rule) — Robust", overlay=false)
// ------- User inputs -------
resetDaily = input.bool(true, "Reset cumulative at new day/session")
showBarHist = input.bool(false, "Show per-bar buy/sell histogram")
useHalfOnEqual = input.bool(true, "Split volume 50/50 when price unchanged")
// ------- Safe previous close and volume -------
prevClose = nz(close[1], close) // avoid na on first bar
vol = float(volume)
// ------- Classification (Tick Rule approximation) -------
buyVol = close > prevClose ? vol : (close < prevClose ? 0.0 : (useHalfOnEqual ? vol * 0.5 : 0.0))
sellVol = close < prevClose ? vol : (close > prevClose ? 0.0 : (useHalfOnEqual ? vol * 0.5 : 0.0))
// ------- Cumulative totals (with optional daily reset) -------
var float cumBuy = 0.0
var float cumSell = 0.0
newDay = time("D") != time("D")[1]
if resetDaily and newDay
cumBuy := 0.0
cumSell := 0.0
cumBuy := cumBuy + buyVol
cumSell := cumSell + sellVol
cumDelta = cumBuy - cumSell
// ------- Plots -------
plot(cumBuy, title="Cumulative Buy Volume", color=color.green, linewidth=2)
plot(cumSell, title="Cumulative Sell Volume", color=color.red, linewidth=2)
plot(cumDelta, title="Cumulative Delta (Buy - Sell)", color=color.blue, linewidth=2)
// optional: per-bar histograms
plot(showBarHist ? buyVol : na, style=plot.style_columns, title="Bar Buy Vol", color=color.new(color.green, 60))
plot(showBarHist ? sellVol : na, style=plot.style_columns, title="Bar Sell Vol", color=color.new(color.red, 60))
نص برمجي مفتوح المصدر
بروح TradingView الحقيقية، قام مبتكر هذا النص البرمجي بجعله مفتوح المصدر، بحيث يمكن للمتداولين مراجعة وظائفه والتحقق منها. شكرا للمؤلف! بينما يمكنك استخدامه مجانًا، تذكر أن إعادة نشر الكود يخضع لقواعد الموقع الخاصة بنا.
إخلاء المسؤولية
لا يُقصد بالمعلومات والمنشورات أن تكون، أو تشكل، أي نصيحة مالية أو استثمارية أو تجارية أو أنواع أخرى من النصائح أو التوصيات المقدمة أو المعتمدة من TradingView. اقرأ المزيد في شروط الاستخدام.