OPEN-SOURCE SCRIPT
تم تحديثه Daily High Low Movement
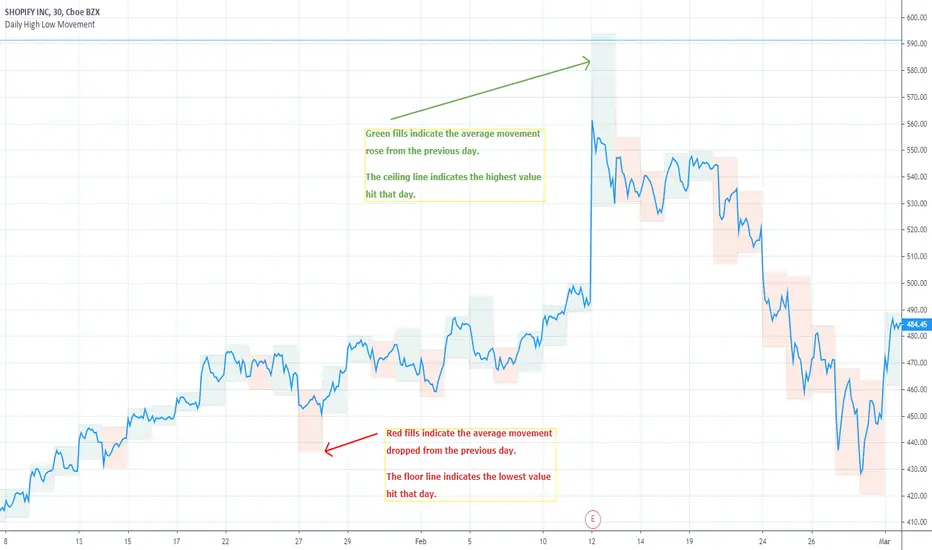
Indicates the daily high and low drawn by green and red lines. Fill blocks indicate the average value movement relevant to the previous day. Green fills indicate that the value is moving higher than the previous day and red meaning lower.
 BA
BA
ملاحظات الأخبار
Updating the comment for an example of use.ملاحظات الأخبار
This capture example shows how to use it for a trailing stop loss. You'll want to never intersect the blocks because the blocks indicate the daily volatility range.ملاحظات الأخبار
Updated example chart.Increased opacity of default fills.
ملاحظات الأخبار
Updated chart example.نص برمجي مفتوح المصدر
بروح TradingView الحقيقية، قام مبتكر هذا النص البرمجي بجعله مفتوح المصدر، بحيث يمكن للمتداولين مراجعة وظائفه والتحقق منها. شكرا للمؤلف! بينما يمكنك استخدامه مجانًا، تذكر أن إعادة نشر الكود يخضع لقواعد الموقع الخاصة بنا.
إخلاء المسؤولية
لا يُقصد بالمعلومات والمنشورات أن تكون، أو تشكل، أي نصيحة مالية أو استثمارية أو تجارية أو أنواع أخرى من النصائح أو التوصيات المقدمة أو المعتمدة من TradingView. اقرأ المزيد في شروط الاستخدام.
نص برمجي مفتوح المصدر
بروح TradingView الحقيقية، قام مبتكر هذا النص البرمجي بجعله مفتوح المصدر، بحيث يمكن للمتداولين مراجعة وظائفه والتحقق منها. شكرا للمؤلف! بينما يمكنك استخدامه مجانًا، تذكر أن إعادة نشر الكود يخضع لقواعد الموقع الخاصة بنا.
إخلاء المسؤولية
لا يُقصد بالمعلومات والمنشورات أن تكون، أو تشكل، أي نصيحة مالية أو استثمارية أو تجارية أو أنواع أخرى من النصائح أو التوصيات المقدمة أو المعتمدة من TradingView. اقرأ المزيد في شروط الاستخدام.