OPEN-SOURCE SCRIPT
تم تحديثه Market Profile Fixed View

Some instruments does not provide any volume information, therefore, as a fixed volume profile user, I needed a fixed market profile indicator to use the same principles, regardless of whether the volumes are available or not.
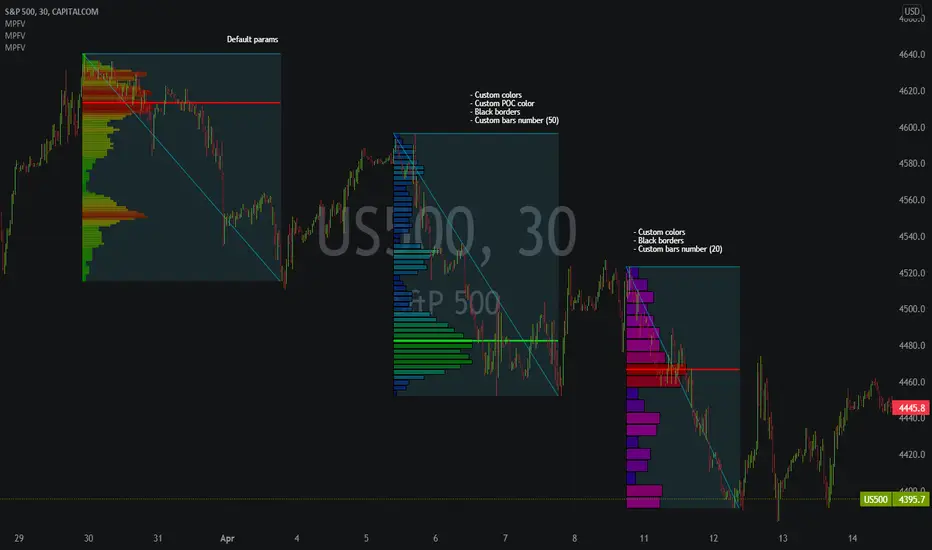
This script draws a market profile histogram corresponding to price variations within a specific duration, you only need to specify Start and End date/time values to see the histogram on your chart.
Details
Options
* Start calculation
* End calculation
* Bars number (histogram resolution, currently locked to a max value of 50 bars)
* Display side/Width (allows to modify size of bars, to the left or to the right)
* Bars/Borders/POC Color customization
Notes
This script draws a market profile histogram corresponding to price variations within a specific duration, you only need to specify Start and End date/time values to see the histogram on your chart.
Details
- Two lines corresponding to highest/lowest prices are displayed around the histogram
- The redline corresponds to the POC (point of control)
Options
* Start calculation
* End calculation
* Bars number (histogram resolution, currently locked to a max value of 50 bars)
* Display side/Width (allows to modify size of bars, to the left or to the right)
* Bars/Borders/POC Color customization
Notes
- This script will probably be updated (to add VAH/VAL zones, and maybe other options). However, some common market profile attributes have not been implemented yet since I don't really use them)
ملاحظات الأخبار
New update with some new options- You can now use 200 bars within a market profile area
- A Heat color feature has been added with customization params
- A background color can be added to the MP area (enabled by default)
ملاحظات الأخبار
Update:the POC line can be extended to the right (disabled by default)
ملاحظات الأخبار
Update:Lowest price line fixed
ملاحظات الأخبار
Updates:- You can now enable/disable histogram, POC, high/low lines and background
نص برمجي مفتوح المصدر
بروح TradingView الحقيقية، قام مبتكر هذا النص البرمجي بجعله مفتوح المصدر، بحيث يمكن للمتداولين مراجعة وظائفه والتحقق منها. شكرا للمؤلف! بينما يمكنك استخدامه مجانًا، تذكر أن إعادة نشر الكود يخضع لقواعد الموقع الخاصة بنا.
إخلاء المسؤولية
لا يُقصد بالمعلومات والمنشورات أن تكون، أو تشكل، أي نصيحة مالية أو استثمارية أو تجارية أو أنواع أخرى من النصائح أو التوصيات المقدمة أو المعتمدة من TradingView. اقرأ المزيد في شروط الاستخدام.