OPEN-SOURCE SCRIPT
Value of my asset
Indicator Name: Value of my asset
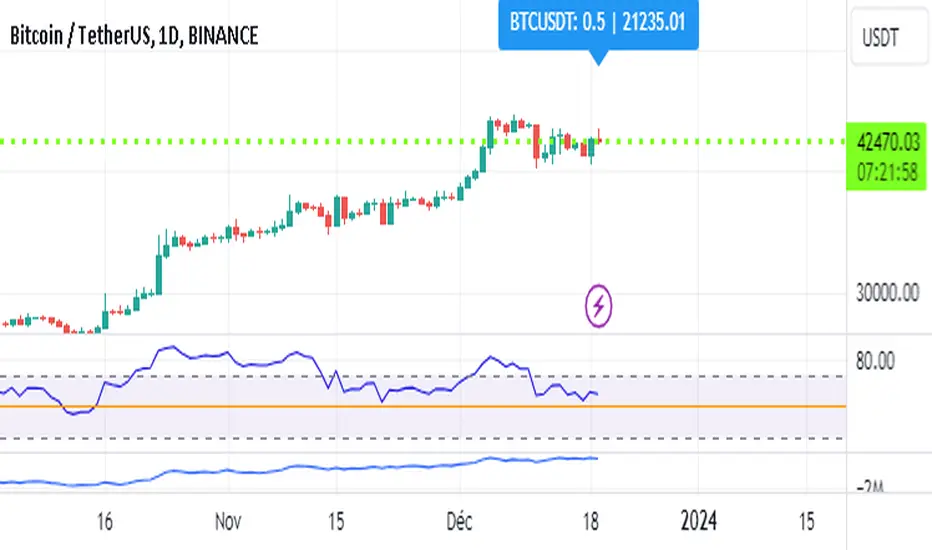
This indicator displays the total value of the asset you hold on a chart. It is particularly useful for tracking the value of your position in real time directly on the chart.
How to use it:
Quantity of the asset in possession: Enter the quantity of the asset you currently hold. By default, this value is 0.
Text color: Choose the color of the text that will be displayed on the chart. By default, this color is white.
Background color: Choose the background color of the label that will be displayed on the chart. By default, this color is blue.
Calculation of the value to display: The value to display is calculated by multiplying the closing value (close) by the quantity of the asset you hold (quantity). This value represents the total value of your position.
Display of the label: A label is displayed on the chart with the symbol of the asset, the quantity you hold, and the total value of your position. This label is updated with each new bar.
نص برمجي مفتوح المصدر
بروح TradingView الحقيقية، قام مبتكر هذا النص البرمجي بجعله مفتوح المصدر، بحيث يمكن للمتداولين مراجعة وظائفه والتحقق منها. شكرا للمؤلف! بينما يمكنك استخدامه مجانًا، تذكر أن إعادة نشر الكود يخضع لقواعد الموقع الخاصة بنا.
إخلاء المسؤولية
لا يُقصد بالمعلومات والمنشورات أن تكون، أو تشكل، أي نصيحة مالية أو استثمارية أو تجارية أو أنواع أخرى من النصائح أو التوصيات المقدمة أو المعتمدة من TradingView. اقرأ المزيد في شروط الاستخدام.