Multi Time Frame MTF Correlation Coefficient meter
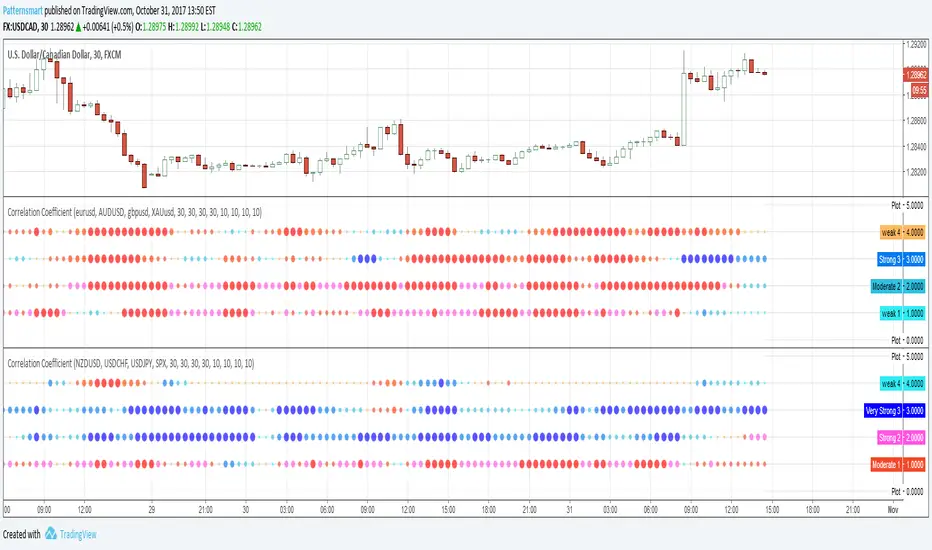
This indicator shows the Correlation Coefficient between the four input symbols and current chart symbol over the corresponding timeframe and period inputs.
You can input four symbols with different aggregation and period settings.
The period input is the number of bars used to calculate the correlation coefficient.
How to Read the Correlation Coefficient indicator
Each dot shows the correlation coefficient between the two symbols over the corresponding timeframe and period inputs. The following categories indicate a quick way of interpreting the table values. Note that a negative correlation means the two currency pairs correlate in the opposite directions (e.g. when the price for one goes up, the other one goes down and vice versa)
Positive 0.0 to 0.25 weak correlation, shown as small cyan dot.
Positive 0.25 to 0.5 Moderate correlation, shown as medium light blue dot.
Positive 0.5 to 0.75 Strong correlation, shown as big light blue dot.
Positive 0.75 to 1.0 Very strong correlation, shown as large blue dot.
Negative 0.0 to 0.25 weak correlation, shown as small orange dot.
Negative 0.25 to 0.5 Moderate correlation, shown as medium orange dot.
Negative 0.5 to 0.75 Strong correlation, shown as big purple dot.
Negative 0.75 to 1.0 Very strong correlation, shown as large red dot.
You can also change the plot style to meet your needs.
نص برمجي للمستخدمين المدعوين فقط
يمكن فقط للمستخدمين الذين تمت الموافقة عليهم من قبل المؤلف الوصول إلى هذا البرنامج النصي. ستحتاج إلى طلب الإذن والحصول عليه لاستخدامه. يتم منح هذا عادةً بعد الدفع. لمزيد من التفاصيل، اتبع تعليمات المؤلف أدناه أو اتصل ب Patternsmart مباشرة.
لا توصي TradingView بالدفع مقابل برنامج نصي أو استخدامه إلا إذا كنت تثق تمامًا في مؤلفه وتفهم كيفية عمله. يمكنك أيضًا العثور على بدائل مجانية ومفتوحة المصدر في نصوص مجتمعنا.
تعليمات المؤلف
إخلاء المسؤولية
نص برمجي للمستخدمين المدعوين فقط
يمكن فقط للمستخدمين الذين تمت الموافقة عليهم من قبل المؤلف الوصول إلى هذا البرنامج النصي. ستحتاج إلى طلب الإذن والحصول عليه لاستخدامه. يتم منح هذا عادةً بعد الدفع. لمزيد من التفاصيل، اتبع تعليمات المؤلف أدناه أو اتصل ب Patternsmart مباشرة.
لا توصي TradingView بالدفع مقابل برنامج نصي أو استخدامه إلا إذا كنت تثق تمامًا في مؤلفه وتفهم كيفية عمله. يمكنك أيضًا العثور على بدائل مجانية ومفتوحة المصدر في نصوص مجتمعنا.