OPEN-SOURCE SCRIPT
RAHUL ATR + Volume Spikes
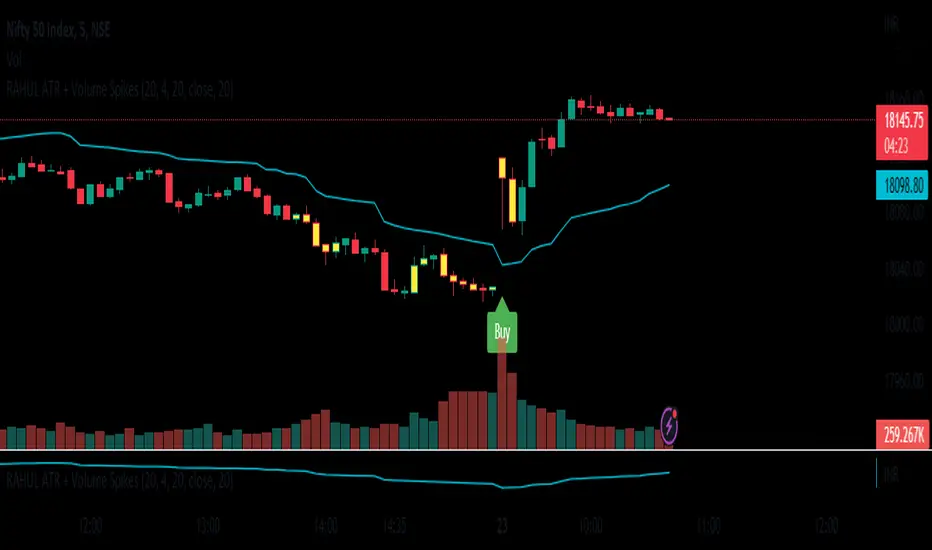
New Volume Spikes Strategy.
The Average True Range (ATR) indicator is a technical analysis tool that measures the volatility of an asset. It can be used to create a trading strategy by identifying periods of high volatility and making trades based on those conditions.
Here is an example of a simple ATR trading strategy:
Calculate the ATR for the asset you are trading. This can typically be done using a charting platform or software.
Identify the average ATR over a period of time (such as 14 days). This will be your "threshold" for determining high volatility.
When the current ATR is above the threshold, enter a long position (buy) in the asset.
When the current ATR is below the threshold, exit the long position (sell) and wait for the next period of high volatility.
Repeat the process for the next period of time.
This is a basic example of an ATR strategy and can be adjusted as per one's preference, you can add other indicators or market conditions to filter out trades and also use different time frame to check the ATR values. ATR can also be used in combination with other indicators and strategies to improve the accuracy of your trades.
It's always important to backtest any strategy before actually trading with real money, and also to consider the risk management, stop loss and profit taking levels, and adjust the strategy accordingly
نص برمجي مفتوح المصدر
بروح TradingView الحقيقية، قام مبتكر هذا النص البرمجي بجعله مفتوح المصدر، بحيث يمكن للمتداولين مراجعة وظائفه والتحقق منها. شكرا للمؤلف! بينما يمكنك استخدامه مجانًا، تذكر أن إعادة نشر الكود يخضع لقواعد الموقع الخاصة بنا.
إخلاء المسؤولية
لا يُقصد بالمعلومات والمنشورات أن تكون، أو تشكل، أي نصيحة مالية أو استثمارية أو تجارية أو أنواع أخرى من النصائح أو التوصيات المقدمة أو المعتمدة من TradingView. اقرأ المزيد في شروط الاستخدام.