OPEN-SOURCE SCRIPT
تم تحديثه F.B_Consolidation Range Identifier

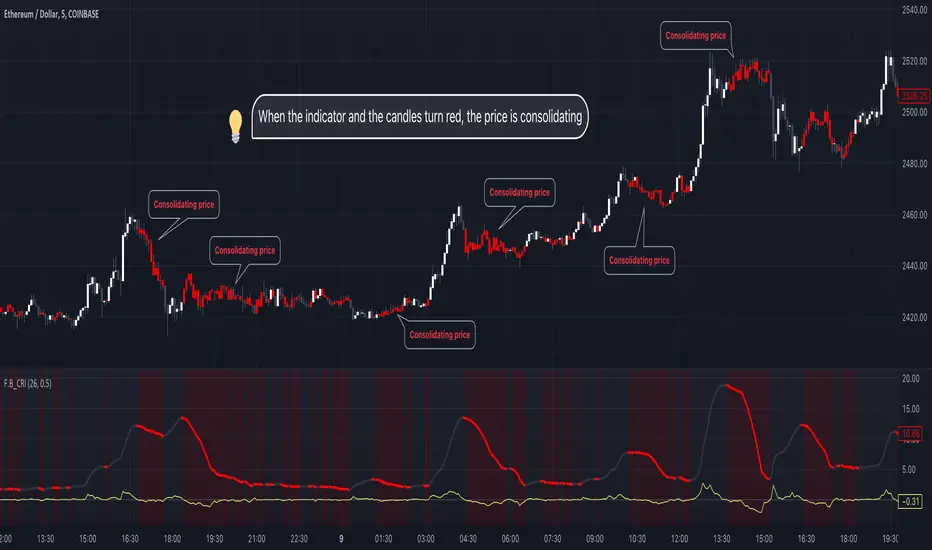
The "F.B_Consolidation Range Identifier" (F.B_CRI) is an indicator aimed at identifying consolidation areas in the price chart. Here is an explanation of the logic and usage of this indicator:
Calculation of Standard Deviation
This indicator analyzes the market's volatility by considering the standard deviation of price movements over a defined period. A higher standard deviation indicates larger price movement, while a lower standard deviation suggests potential consolidation, where price movements are limited.
Derivation of Standard Deviation
To track changes in volatility, the derivative of the standard deviation is calculated. Positive derivative values indicate increasing volatility, while negative values suggest a decrease in volatility. This allows for the identification of potential consolidation phases where volatility decreases, and the market may stabilize.
Identification of Consolidation Phase
The indicator signals potential consolidation phases when the standard deviation is low and/or the derivative of the standard deviation is negative. To represent consolidation phases on the chart, the standard deviation line, background, and candles are colored red. However, it's important to note that the display is customizable and can be configured according to individual needs.
🚨 Important 🚨
The indicator only indicates whether consolidation phases exist. If the standard deviation line, background, or candles are gray, it indicates that a trend exists in general, but not whether it is bullish or bearish. It is advisable to use other analytical tools to confirm the direction of the trend.
ملاحظات الأخبار
Timeframe selection in settingsنص برمجي مفتوح المصدر
بروح TradingView الحقيقية، قام مبتكر هذا النص البرمجي بجعله مفتوح المصدر، بحيث يمكن للمتداولين مراجعة وظائفه والتحقق منها. شكرا للمؤلف! بينما يمكنك استخدامه مجانًا، تذكر أن إعادة نشر الكود يخضع لقواعد الموقع الخاصة بنا.
إخلاء المسؤولية
لا يُقصد بالمعلومات والمنشورات أن تكون، أو تشكل، أي نصيحة مالية أو استثمارية أو تجارية أو أنواع أخرى من النصائح أو التوصيات المقدمة أو المعتمدة من TradingView. اقرأ المزيد في شروط الاستخدام.
نص برمجي مفتوح المصدر
بروح TradingView الحقيقية، قام مبتكر هذا النص البرمجي بجعله مفتوح المصدر، بحيث يمكن للمتداولين مراجعة وظائفه والتحقق منها. شكرا للمؤلف! بينما يمكنك استخدامه مجانًا، تذكر أن إعادة نشر الكود يخضع لقواعد الموقع الخاصة بنا.
إخلاء المسؤولية
لا يُقصد بالمعلومات والمنشورات أن تكون، أو تشكل، أي نصيحة مالية أو استثمارية أو تجارية أو أنواع أخرى من النصائح أو التوصيات المقدمة أو المعتمدة من TradingView. اقرأ المزيد في شروط الاستخدام.