OPEN-SOURCE SCRIPT
Percentage MACD Enhanced 3
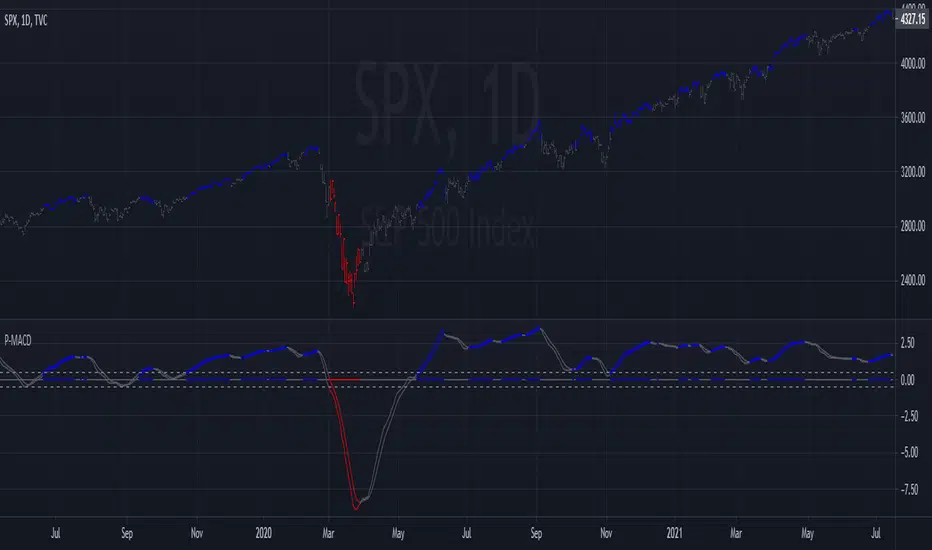
This MACD is calculated using percentage above or below the zero line for consistency and compatibility across different stocks and markets. The price bars are colored when MACD is above/below extreme levels and crossed in that direction. The intention is to use this setting on a longer time frame and trade only in the direction the bars are colored. This setting is also a powerful way to take profits! As usual, my scripts are public for scrutiny and to adjust for your personal needs.
نص برمجي مفتوح المصدر
بروح TradingView الحقيقية، قام مبتكر هذا النص البرمجي بجعله مفتوح المصدر، بحيث يمكن للمتداولين مراجعة وظائفه والتحقق منها. شكرا للمؤلف! بينما يمكنك استخدامه مجانًا، تذكر أن إعادة نشر الكود يخضع لقواعد الموقع الخاصة بنا.
إخلاء المسؤولية
لا يُقصد بالمعلومات والمنشورات أن تكون، أو تشكل، أي نصيحة مالية أو استثمارية أو تجارية أو أنواع أخرى من النصائح أو التوصيات المقدمة أو المعتمدة من TradingView. اقرأ المزيد في شروط الاستخدام.