PROTECTED SOURCE SCRIPT
تم تحديثه Index Volume
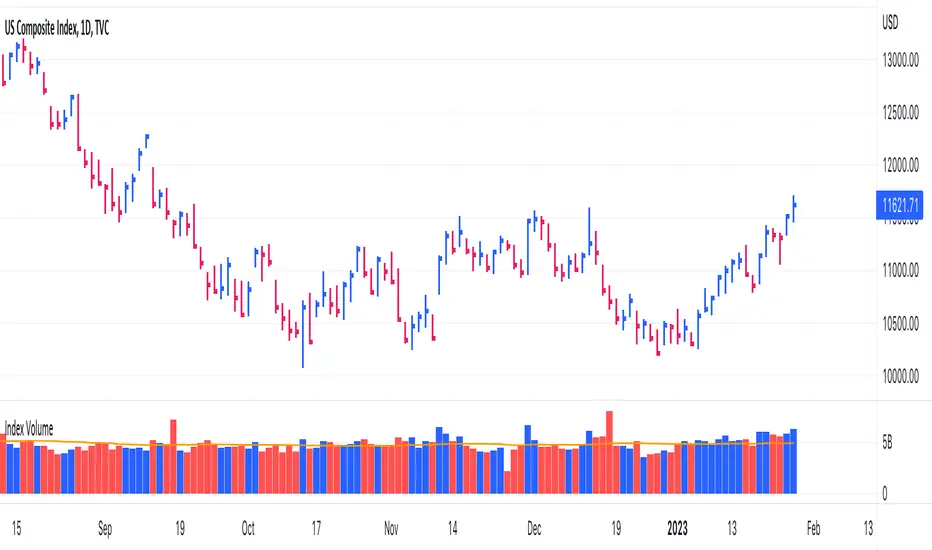
This indicator displays the volume for the Nasdaq Composite and S&P500 indexes just like any other stock. Also displays any normal stock volume as well. Customizations include choice of colors and moving average length.
ملاحظات الأخبار
New option to automatically plot a diamond on follow through and distribution days. Also have the ability to show distribution clusters. (4 distribution days in a rolling 8 day window) ملاحظات الأخبار
Cleaned up the status line display to only show Volume and Volume Averageملاحظات الأخبار
Added ability for volatility adjusted follow through days, as defined in IBD's Market School. - Volatility defined as the average percentage gain of the up days over the prior 200 days.
- Volatility less than or equal to 0.4%, follow-through must close up 0.7% or higher.
- Volatility greater than or equal to 0.4% and less than 0.55%, follow-through must close up 0.85% or higher.
- Volatility greater than or equal to 0.55% and less than 1.00%, follow-through must close up 1.00% or higher.
- Volatility greater than or equal to 1.00%, follow-through must close up 1.245% or higher.
ملاحظات الأخبار
Updated volume source for the indexes, should update in real time now. ملاحظات الأخبار
Update shows volume run rate on stocks. نص برمجي محمي
تم نشر هذا النص البرمجي كمصدر مغلق. ومع ذلك، يمكنك استخدامه بحرية ودون أي قيود - تعرف على المزيد هنا.
Trusted Pine programmer. Send me a message for script development.
إخلاء المسؤولية
لا يُقصد بالمعلومات والمنشورات أن تكون، أو تشكل، أي نصيحة مالية أو استثمارية أو تجارية أو أنواع أخرى من النصائح أو التوصيات المقدمة أو المعتمدة من TradingView. اقرأ المزيد في شروط الاستخدام.
نص برمجي محمي
تم نشر هذا النص البرمجي كمصدر مغلق. ومع ذلك، يمكنك استخدامه بحرية ودون أي قيود - تعرف على المزيد هنا.
Trusted Pine programmer. Send me a message for script development.
إخلاء المسؤولية
لا يُقصد بالمعلومات والمنشورات أن تكون، أو تشكل، أي نصيحة مالية أو استثمارية أو تجارية أو أنواع أخرى من النصائح أو التوصيات المقدمة أو المعتمدة من TradingView. اقرأ المزيد في شروط الاستخدام.