OPEN-SOURCE SCRIPT
Dual Strength RSI
Dual Strength RSI Indicator
Republished: The original script violated house rules by including an external link to Backtest Rookies.
Background
This is a simple indicator was designed as part of a tutorial on the Backtest-Rookies website.
Logic
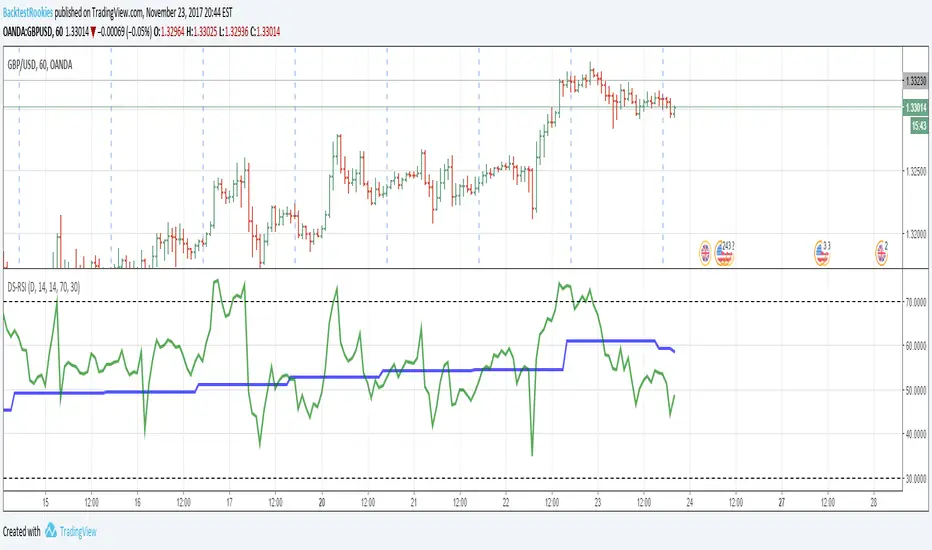
The indicator will plot RSI values from 2 timeframes. The first plotted line will be the current timeframe and the second line will be a user selected timeframe. The theory is that if the instrument is overbought / oversold on two timeframes at the same time, it might be more likely to reverse or revert to the mean.
As with most oscillating indicators, this will likely be most suitable for ranging market conditions.
Examples


Republished: The original script violated house rules by including an external link to Backtest Rookies.
Background
This is a simple indicator was designed as part of a tutorial on the Backtest-Rookies website.
Logic
The indicator will plot RSI values from 2 timeframes. The first plotted line will be the current timeframe and the second line will be a user selected timeframe. The theory is that if the instrument is overbought / oversold on two timeframes at the same time, it might be more likely to reverse or revert to the mean.
As with most oscillating indicators, this will likely be most suitable for ranging market conditions.
Examples
نص برمجي مفتوح المصدر
بروح TradingView الحقيقية، قام مبتكر هذا النص البرمجي بجعله مفتوح المصدر، بحيث يمكن للمتداولين مراجعة وظائفه والتحقق منها. شكرا للمؤلف! بينما يمكنك استخدامه مجانًا، تذكر أن إعادة نشر الكود يخضع لقواعد الموقع الخاصة بنا.
إخلاء المسؤولية
لا يُقصد بالمعلومات والمنشورات أن تكون، أو تشكل، أي نصيحة مالية أو استثمارية أو تجارية أو أنواع أخرى من النصائح أو التوصيات المقدمة أو المعتمدة من TradingView. اقرأ المزيد في شروط الاستخدام.