OPEN-SOURCE SCRIPT
BBI Bollinger Bands
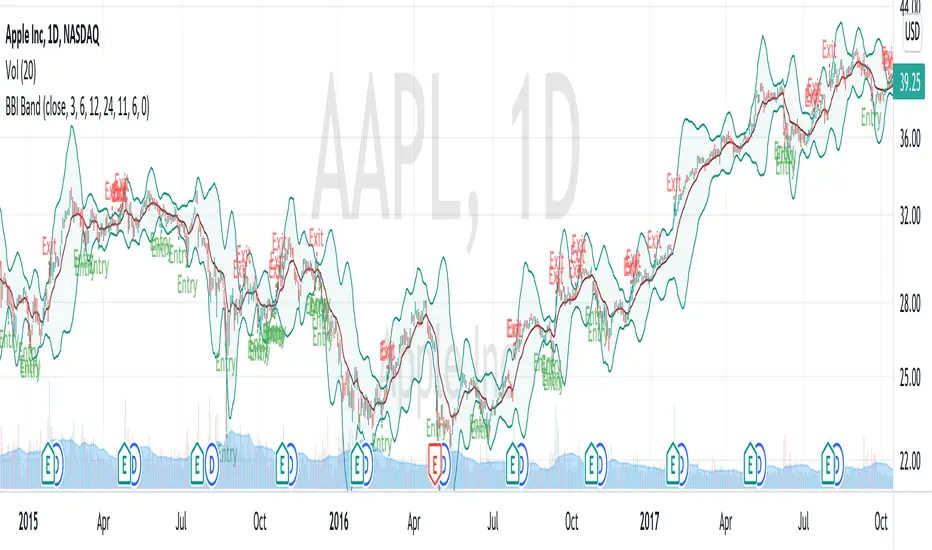
BBI (Bull and Bear Index) is an indicator aims on measuring the general short/mid-term (< 1 month) trend and sentiment of the stock/market. It used an average of 4 SMAs (3, 6, 12, 24) as a cut-off of a bullish/bearish trend. In general, YMMV, you can enter when close> BBI and exit when close<BBI.
BBI Bollinger Bands uses BBI as "basis" and calculates variations (Stdev) of BBI during the past several days. In general, BBI Boll band is more volatile than the traditional Boll Band.
The "possible entry and exit" function is for fun, trying to spot the point where there is extreme fear and optimism, not necessarily working yet.
نص برمجي مفتوح المصدر
بروح TradingView الحقيقية، قام مبتكر هذا النص البرمجي بجعله مفتوح المصدر، بحيث يمكن للمتداولين مراجعة وظائفه والتحقق منها. شكرا للمؤلف! بينما يمكنك استخدامه مجانًا، تذكر أن إعادة نشر الكود يخضع لقواعد الموقع الخاصة بنا.
إخلاء المسؤولية
لا يُقصد بالمعلومات والمنشورات أن تكون، أو تشكل، أي نصيحة مالية أو استثمارية أو تجارية أو أنواع أخرى من النصائح أو التوصيات المقدمة أو المعتمدة من TradingView. اقرأ المزيد في شروط الاستخدام.