OPEN-SOURCE SCRIPT
تم تحديثه Histogram - Price Action - Dy Calculator
This script aims to help users of Price Action robot, for Smarttbot (brazilian site that automates Brazilian market (B3)).
You can use on any symbol.
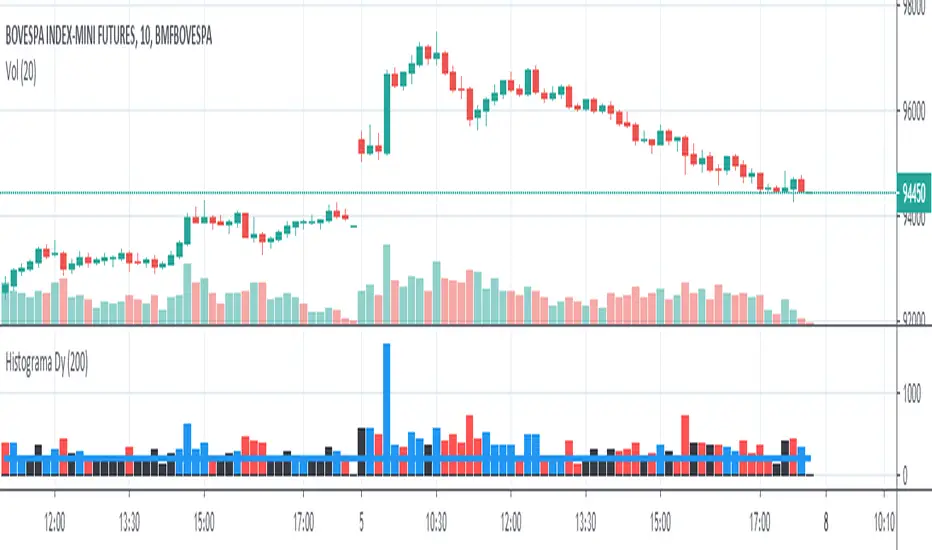
The script will follow price action principles. It will calculate the absolute value of last candle and compare with actual candle. Colors are:
- Red - If the actual candle absolute value is higher than previous one, and the price is lower than last candle. It would be a short entry.
- Blue - If the actual candle absolute value is higher than previous one, and the price is higher than last candle. It would be a long entry.
- Black - The actual candle absolute value is lower than previous one, so there is no entry.
If there is a candle that is higher than previous one, and both high and low values are outside boundaries of previous one, it will calculate which boundary is bigger and will apply the collor accordingly.
You can use on any symbol.
The script will follow price action principles. It will calculate the absolute value of last candle and compare with actual candle. Colors are:
- Red - If the actual candle absolute value is higher than previous one, and the price is lower than last candle. It would be a short entry.
- Blue - If the actual candle absolute value is higher than previous one, and the price is higher than last candle. It would be a long entry.
- Black - The actual candle absolute value is lower than previous one, so there is no entry.
If there is a candle that is higher than previous one, and both high and low values are outside boundaries of previous one, it will calculate which boundary is bigger and will apply the collor accordingly.
ملاحظات الأخبار
V4 - Better candle rupture detection, now it only marks as a rupture when last candle price (high-low) is bigger than dy and it had a rupture.نص برمجي مفتوح المصدر
بروح TradingView الحقيقية، قام مبتكر هذا النص البرمجي بجعله مفتوح المصدر، بحيث يمكن للمتداولين مراجعة وظائفه والتحقق منها. شكرا للمؤلف! بينما يمكنك استخدامه مجانًا، تذكر أن إعادة نشر الكود يخضع لقواعد الموقع الخاصة بنا.
إخلاء المسؤولية
لا يُقصد بالمعلومات والمنشورات أن تكون، أو تشكل، أي نصيحة مالية أو استثمارية أو تجارية أو أنواع أخرى من النصائح أو التوصيات المقدمة أو المعتمدة من TradingView. اقرأ المزيد في شروط الاستخدام.
نص برمجي مفتوح المصدر
بروح TradingView الحقيقية، قام مبتكر هذا النص البرمجي بجعله مفتوح المصدر، بحيث يمكن للمتداولين مراجعة وظائفه والتحقق منها. شكرا للمؤلف! بينما يمكنك استخدامه مجانًا، تذكر أن إعادة نشر الكود يخضع لقواعد الموقع الخاصة بنا.
إخلاء المسؤولية
لا يُقصد بالمعلومات والمنشورات أن تكون، أو تشكل، أي نصيحة مالية أو استثمارية أو تجارية أو أنواع أخرى من النصائح أو التوصيات المقدمة أو المعتمدة من TradingView. اقرأ المزيد في شروط الاستخدام.