SMART indicator
The trigger of Buy and Sell Signals are calculated through the SMA and ATR:
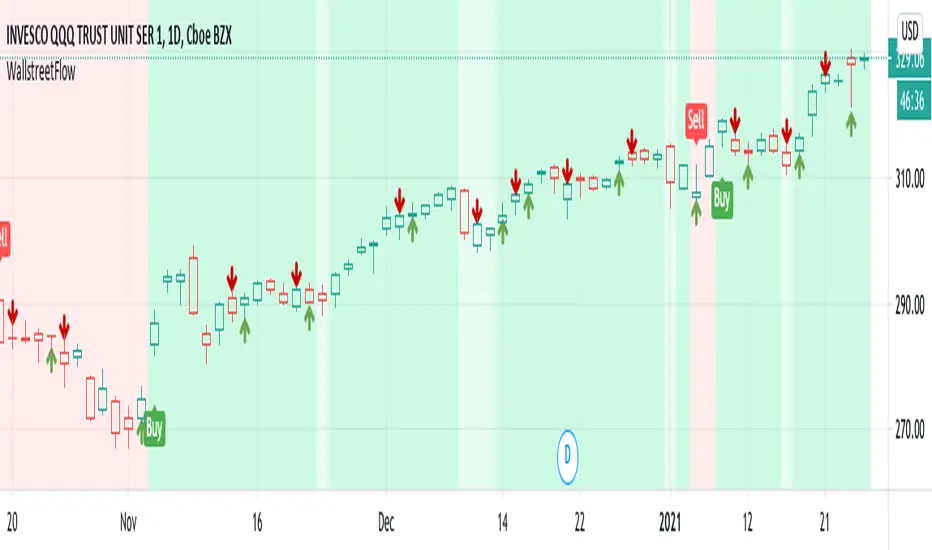
* Buy Signals: They are highlighted by a dark green background area.
* Sell Signals: They are highlighted by a dark red background area.
The trigger of Close Buy and Close Sell Signals are calculated through current price using SMA and ATR:
* Close Buy Signals: The fast SMA crosses under the close price and at the same time the trend is bullish. They are highlighted by a lighter green area.
* Close Sell Signals: The fast SMA crosses over the close price and at the same time the trend is bearish. They are highlighted by a lighter red area
Few important points about the indicator and the produced signals:
* This is not intended to be a strategy, but an indicator for analyzing the market conditions. It gives you the triggers depending on the real time analysis of the prices, but not being a proper strategy, pay attention about "fake signals" and add always a visual analysis to the provided signals
* Following this indicator, the trade positions should be opened only when background color appears GREEN. Either in this case, analyze the chart in order to see if the signals are "weak" ones, due to "waves" around the SMA . In these cases, you might wait for the next confirmation signals after the waves, when the trend will be better defined
* The close trade signals are provided in order to help to understand when you should close the buy or sell trades. Even in this case, always add a visual analysis to the signals, and pay attention to the support/resistance areas. Sometimes, you can have the close signals in correspondence to support/resistance areas: in these cases wait for the definition of the trend and eventually for the next close trade signals if they will be better defined
Final Notes
* Indicator will show Trend, Pullback, Market bounce and some support and resistance level.
نص برمجي للمستخدمين المدعوين فقط
يمكن فقط للمستخدمين الذين تمت الموافقة عليهم من قبل المؤلف الوصول إلى هذا البرنامج النصي. ستحتاج إلى طلب الإذن والحصول عليه لاستخدامه. يتم منح هذا عادةً بعد الدفع. لمزيد من التفاصيل، اتبع تعليمات المؤلف أدناه أو اتصل ب WallStreetFlow مباشرة.
لا توصي TradingView بالدفع مقابل برنامج نصي أو استخدامه إلا إذا كنت تثق تمامًا في مؤلفه وتفهم كيفية عمله. يمكنك أيضًا العثور على بدائل مجانية ومفتوحة المصدر في نصوص مجتمعنا.
تعليمات المؤلف
إخلاء المسؤولية
نص برمجي للمستخدمين المدعوين فقط
يمكن فقط للمستخدمين الذين تمت الموافقة عليهم من قبل المؤلف الوصول إلى هذا البرنامج النصي. ستحتاج إلى طلب الإذن والحصول عليه لاستخدامه. يتم منح هذا عادةً بعد الدفع. لمزيد من التفاصيل، اتبع تعليمات المؤلف أدناه أو اتصل ب WallStreetFlow مباشرة.
لا توصي TradingView بالدفع مقابل برنامج نصي أو استخدامه إلا إذا كنت تثق تمامًا في مؤلفه وتفهم كيفية عمله. يمكنك أيضًا العثور على بدائل مجانية ومفتوحة المصدر في نصوص مجتمعنا.