OPEN-SOURCE SCRIPT
Gedhusek UltraTrend

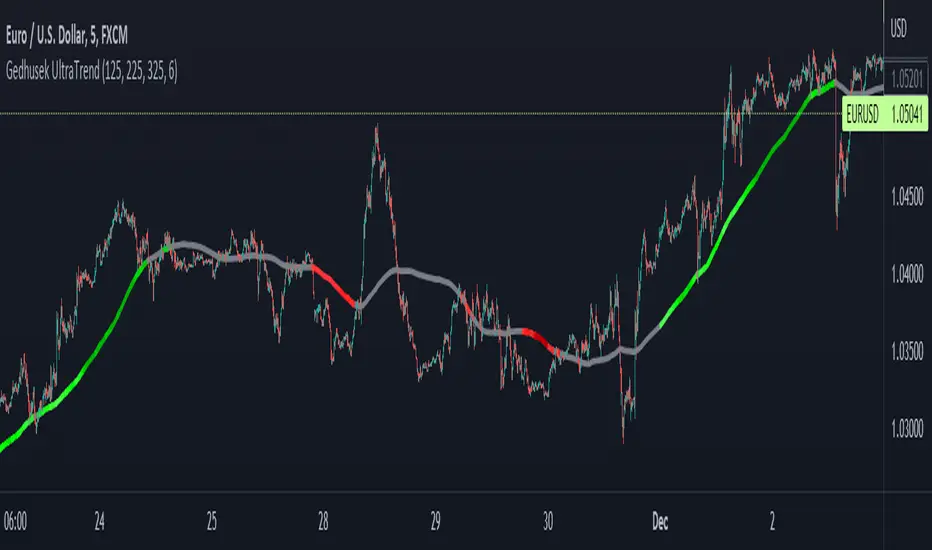
This indicator serves a purpose of a trend recognizer. It is able to tell you whether the market is bullish, bearish or if the price goes sideways.
Process of determining the trend:
- The indicator uses 3 moving averages to determine the trend
- For each of these averages, there is calculated value change over a certain period. So, if the value of Moving average was 100 and now it is 110, the change is going to be +10
- After these calculations are done, all three of these values are summed up into one
- Based on this value we can determine whether the overall sentiment is bullish or bearish (if the value is larger than 0, the sentiment is bullish and if it is bellow 0, it is bearish)
- One more metric is used when determining the overall trend, and that is the ATR indicator. This indicator represents a certain movement threshold that has to be surpassed in order to have a valid trend
- So all of this can be summed up into this -> if the summed up value of the value shift of 3 moving averages over certain period is larger than ATR value for certain period, the trend is considered as bullish and if this summed up value is lower than ATR value *-1, the trend is considered as bearish. In case the summed value is smaller than ATR value and larger than ATR value *-1, there is no trend.
-----------------------------------------------------------------------------------------
How to use the Indicator:
- The indicator should be used as a tool for giving you a generic feel about the current trend
- It is not a signal providing system
- It can be adjusted for any trading style by changing the Periods in input menu. (As the values are lower, it will give you more short time trend and vice versa)
- It is a great tool to combine with any trend following strategy
-----------------------------------------------------------------------------------------
Which markets and TimeFrame:
- The UltraTrend Indicator works on all of the markets and all of the TF
- I usually use it on 15min and 1H TF, but that is solely my preference
-----------------------------------------------------------------------------------------
Inputs:
First Period = Period of the first MA
Second Period = Period of the second MA
Third Period = Period of the third MA
ATR Period = Period of the ATR
نص برمجي مفتوح المصدر
بروح TradingView الحقيقية، قام مبتكر هذا النص البرمجي بجعله مفتوح المصدر، بحيث يمكن للمتداولين مراجعة وظائفه والتحقق منها. شكرا للمؤلف! بينما يمكنك استخدامه مجانًا، تذكر أن إعادة نشر الكود يخضع لقواعد الموقع الخاصة بنا.
إخلاء المسؤولية
لا يُقصد بالمعلومات والمنشورات أن تكون، أو تشكل، أي نصيحة مالية أو استثمارية أو تجارية أو أنواع أخرى من النصائح أو التوصيات المقدمة أو المعتمدة من TradingView. اقرأ المزيد في شروط الاستخدام.