OPEN-SOURCE SCRIPT
تم تحديثه Multi timeframe Stochastic RSI Screener by noop42

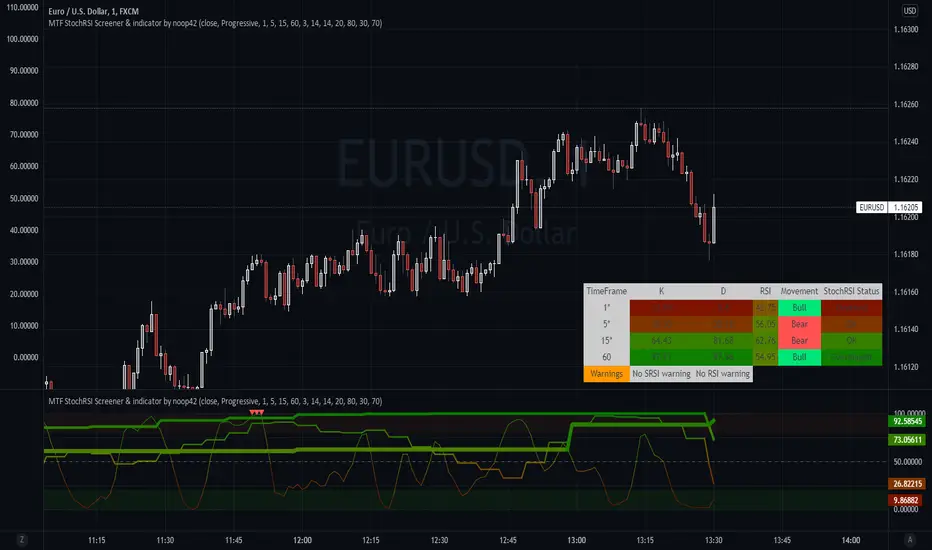
Here is a custom x4 timeframes Stochastic RSI screener to add on your charts.
Options
Default parameters
Notes
Use the lowest timeframe configured on the screener to get real values
A classic x3 multi-timeframe Stochastic RSI indicator is also available https://fr.tradingview.com/script/OwRzXzIb/
Options
- Repaint mode : if enabled: values are updated in live, if disabled: values are updated once the concerned candle is closed
Default parameters
- Timeframes: 1, 5, 15, 60
- Repaint mode: enabled
Notes
Use the lowest timeframe configured on the screener to get real values
A classic x3 multi-timeframe Stochastic RSI indicator is also available https://fr.tradingview.com/script/OwRzXzIb/
ملاحظات الأخبار
This update includes the indicator and the screener I previously developed.Updates:
- The oscillator prints the fourth timeframe which have already been included in the screener
- The screener is now including a warning field to show overbought/oversold signals convergence, which could indicate an incoming movement reversal (Warnings are calculated on the three lowest timeframes (the highest is ignored))
- Warnings are calculated on the three lowest timeframes (the highest is ignored)
- The screener can be disabled
- Overbought and Oversold signals are now based on the average value between K and D lines
- Up and Down triangles have been added to the oscillator to show OB/OS convergences
- Visual improvements
Note: This is an indicator, not a complete and trustable strategy
Hope you'll enjoy it :)
ملاحظات الأخبار
Updates- A column showing each timeframe's RSI value has been added to the screener
- Floating values have been limited to only 2 digits after the comma
- A second warning field concerning the three lowest timeframes' RSI have been added to show OB/OS convergences
ملاحظات الأخبار
Update- New option to select which timeframe(s) must be taken into consideration for convergence signals (Selected timeframes can be distinguished in the screener, followed by a * char in the timeframes column).
- If you plan to use the screener only and to move it on your main chart, you can now disable displays of stochastic rsi lines and zones. (thx to EtCrt for the idea)
ملاحظات الأخبار
Updates- A new color mode has been added. When enabled, it automatically apply the appropriate color from green to red (on the screener, and also on lines when the average mode is enabled). This is the new default color mode.
- Converted to Pinescript v5
نص برمجي مفتوح المصدر
بروح TradingView الحقيقية، قام مبتكر هذا النص البرمجي بجعله مفتوح المصدر، بحيث يمكن للمتداولين مراجعة وظائفه والتحقق منها. شكرا للمؤلف! بينما يمكنك استخدامه مجانًا، تذكر أن إعادة نشر الكود يخضع لقواعد الموقع الخاصة بنا.
إخلاء المسؤولية
لا يُقصد بالمعلومات والمنشورات أن تكون، أو تشكل، أي نصيحة مالية أو استثمارية أو تجارية أو أنواع أخرى من النصائح أو التوصيات المقدمة أو المعتمدة من TradingView. اقرأ المزيد في شروط الاستخدام.