OPEN-SOURCE SCRIPT
Highs&Lows by Hour
Highs & Lows by Hour
Description:
Highs & Lows by Hour is a TradingView indicator that helps traders identify the most frequent hours at which daily high and low price points occur. By analyzing historical price data directly from the TradingView chart, this tool provides valuable insights into market timing, allowing traders to optimize their strategies around key price movements.
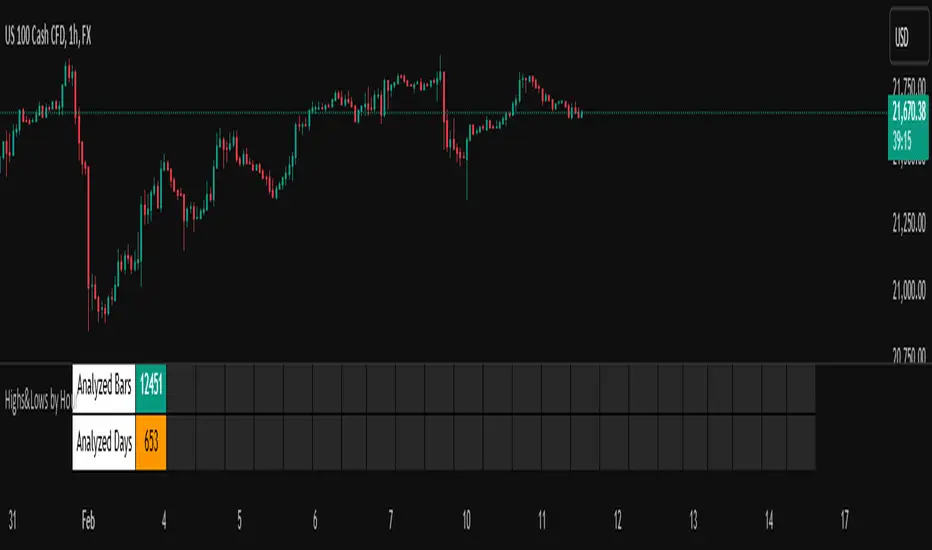
This indicator is specifically designed for the one-hour (H1) timeframe. It does not display any data on other timeframes, as it relies on analyzing daily highs and lows within hourly periods.
This indicator processes the available data based on the number of historical bars loaded in the TradingView chart. The number of analyzed bars depends on the TradingView subscription plan, which determines how much historical data is accessible.
Key Features:
How It Works:
Why Use This Indicator?
Important Notes:
How to Use:
Description:
Highs & Lows by Hour is a TradingView indicator that helps traders identify the most frequent hours at which daily high and low price points occur. By analyzing historical price data directly from the TradingView chart, this tool provides valuable insights into market timing, allowing traders to optimize their strategies around key price movements.
This indicator is specifically designed for the one-hour (H1) timeframe. It does not display any data on other timeframes, as it relies on analyzing daily highs and lows within hourly periods.
This indicator processes the available data based on the number of historical bars loaded in the TradingView chart. The number of analyzed bars depends on the TradingView subscription plan, which determines how much historical data is accessible.
Key Features:
- Works exclusively on the H1 timeframe, ensuring accurate analysis of daily highs and lows
- Hourly highs and lows analysis to identify the most frequent hours when the market reaches its daily high and low
- Sorted by frequency, displaying the most significant trading hours in descending order based on their recurrence
- Customizable table and colors to fit the chart theme and trading style
- Useful for scalpers, day traders, and swing traders to anticipate potential price reversals and breakouts
How It Works:
- The indicator scans historical price data directly from the TradingView chart to detect the hour at which daily highs and daily lows occur.
- It counts the frequency of highs and lows for each hour of the trading day based on the number of available bars in the TradingView chart.
- The recorded data is displayed in a structured table, sorted by frequency from highest to lowest.
- Users can customize colors to enhance readability and seamlessly integrate the indicator into their analysis.
Why Use This Indicator?
- Identify key market patterns by recognizing the most critical hours when price extremes tend to form
- Improve timing for trades by aligning entries and exits with high-probability time windows
- Enhance market awareness by understanding when market volatility is likely to peak based on historical trends
Important Notes:
- This indicator works only on the one-hour (H1) timeframe. It will not display any data on other timeframes
- Works well on Forex, stocks, crypto, and futures, especially for intraday traders
- The indicator analyzes only the historical bars available on the TradingView chart, which varies depending on the TradingView subscription plan (Free, Pro, Pro+, Premium)
- This indicator does not generate buy or sell signals but serves as a data-driven tool for market analysis
How to Use:
- Apply the Highs & Lows by Hour indicator to a one-hour (H1) chart on TradingView
- Review the table displaying the most frequent hours for daily highs and lows
- Adjust colors and settings for better visualization
- Use the data to refine trading decisions and align strategy with historical price behavior
نص برمجي مفتوح المصدر
بروح TradingView الحقيقية، قام مبتكر هذا النص البرمجي بجعله مفتوح المصدر، بحيث يمكن للمتداولين مراجعة وظائفه والتحقق منها. شكرا للمؤلف! بينما يمكنك استخدامه مجانًا، تذكر أن إعادة نشر الكود يخضع لقواعد الموقع الخاصة بنا.
إخلاء المسؤولية
لا يُقصد بالمعلومات والمنشورات أن تكون، أو تشكل، أي نصيحة مالية أو استثمارية أو تجارية أو أنواع أخرى من النصائح أو التوصيات المقدمة أو المعتمدة من TradingView. اقرأ المزيد في شروط الاستخدام.