OPEN-SOURCE SCRIPT
Momentum Rotation Indicator [CC]
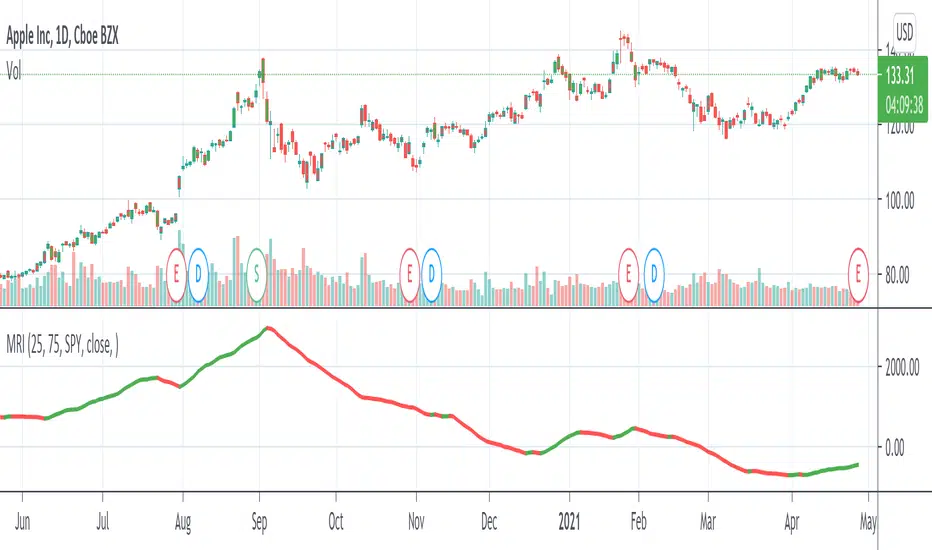
I have developed this custom indicator very loosely based on the Sector Rotation Model (Giorgos E. Siligardos. Technical Analysis of Stocks & Commodities, August 2012) and I called it the MRI because this is essentially a brain scan of any particular stock. This will not only tell you when a stock is breaking out over the market at large but also how the stock is doing compared to its own history. Buy when the line turns green and sell when the line turns red.
Let me know if there are any other indicators you would like to see me publish!
Let me know if there are any other indicators you would like to see me publish!
نص برمجي مفتوح المصدر
بروح TradingView الحقيقية، قام مبتكر هذا النص البرمجي بجعله مفتوح المصدر، بحيث يمكن للمتداولين مراجعة وظائفه والتحقق منها. شكرا للمؤلف! بينما يمكنك استخدامه مجانًا، تذكر أن إعادة نشر الكود يخضع لقواعد الموقع الخاصة بنا.
إخلاء المسؤولية
لا يُقصد بالمعلومات والمنشورات أن تكون، أو تشكل، أي نصيحة مالية أو استثمارية أو تجارية أو أنواع أخرى من النصائح أو التوصيات المقدمة أو المعتمدة من TradingView. اقرأ المزيد في شروط الاستخدام.