OPEN-SOURCE SCRIPT
Volume Delta & Divergence (VDD) by CoryP1990 – Quant Toolkit
Volume Delta & Divergence (VDD) visualizes directional order flow by tracking session-aware Cumulative Volume Delta (CVD) and highlighting structural mismatches between price pivots and CVD. It’s designed to catch persistent buying/selling pressure and to flag divergences where price moves without supporting order flow.
How it works
Per-bar delta: classify ticks as uptick or downtick using price change inside each bar; compute delta = uptickVol − downtickVol.
Cumulative Delta (CVD): sum delta across the session (optional continuous mode available).
Smooth: apply an EMA to the CVD (CVD-EMA) to reduce noise and reveal structural shifts.
Divergence detection: detect price pivots (left/right = X bars); sample the CVD-EMA at the exact pivot bars and compare the last two price pivots vs the corresponding CVD-EMA values.
Bear divergence: price makes a higher high while CVD-EMA makes a lower high → fading buy pressure at the top.
Bull divergence: price makes a lower low while CVD-EMA makes a higher low → improving buying pressure into the lows.
Markers: non-repainting pivot confirmation requirement (markers appear only after pivots are confirmed) and markers are placed on the actual pivot bar for clarity.
Visuals / legend
Teal line: CVD-EMA (smoothed cumulative delta). Rising → net buying pressure; falling → net selling pressure.
Red triangle (above): Bear divergence - price HH vs CVD LH.
Green triangle (below): Bull divergence - price LL vs CVD HL.
No background tint - VDD is a structural order flow tool (markers + CVD line only). Use the VWMA / trend overlays to provide directional context.
Use cases
Detect hidden exhaustion at highs (fade setups) and hidden accumulation at lows (bounce setups).
Confirm or invalidate momentum moves: price rising but CVD falling warns the move lacks order flow support.
Spot campaign-style pressure across a session (session reset) versus multi-day campaigns (disable reset).
Combine with VWMA(50) or higher-TF alignment to filter signals and increase quality.
Defaults
CVD EMA length = 34
Pivot left/right = 5
Reset CVD at session start = ON (recommended for intraday)
Show raw CVD = OFF
Marker size = small (use normal for screenshots)
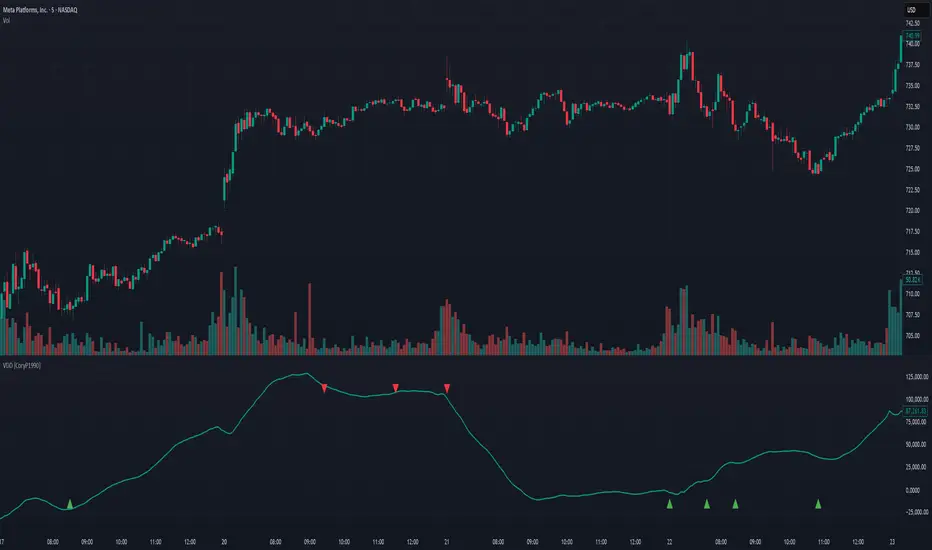
Example — META (5m, 5-day view)
The 5-day time range 5-minute interval on META shows the pattern VDD is built for: a midday bear divergence (price ticks to a marginal high while the CVD-EMA flattens and then rolls lower) that precedes a multi-hour drift lower, and later bull divergences near intraday lows where the CVD-EMA prints higher lows as price prints lower lows, followed by constructive bounces. With resetSession=ON you can see these flows replay across sessions and judge whether a divergence is isolated or repeated (higher-quality).
Practical tips
Default demo: 5-minute chart on liquid names (META, AAPL, SPY) - lenEMA=34, pivot=5, resetSession=ON.
Scalp: 1m with shorter EMA (e.g., 13) and pivot=3.
Swing / campaign: 4H/Daily with resetSession=OFF and longer EMA (e.g., 89).
Filter with VWMA(50) and require above-average volume at the pivot region for higher-probability signals.
Use alerts (script exposes bear/bull alertconditions) to monitor divergences in real time.
Limitations / disclaimers
Markers are confirmation-based (non-repainting), i.e. they appear after the pivot completes, not as a predictive tick.
No single divergence equals a trade; combine with trend, volume, and risk management.
Part of the Quant Toolkit — transparent, open-source indicators for modern quantitative analysis. Built by CoryP1990.
How it works
Per-bar delta: classify ticks as uptick or downtick using price change inside each bar; compute delta = uptickVol − downtickVol.
Cumulative Delta (CVD): sum delta across the session (optional continuous mode available).
Smooth: apply an EMA to the CVD (CVD-EMA) to reduce noise and reveal structural shifts.
Divergence detection: detect price pivots (left/right = X bars); sample the CVD-EMA at the exact pivot bars and compare the last two price pivots vs the corresponding CVD-EMA values.
Bear divergence: price makes a higher high while CVD-EMA makes a lower high → fading buy pressure at the top.
Bull divergence: price makes a lower low while CVD-EMA makes a higher low → improving buying pressure into the lows.
Markers: non-repainting pivot confirmation requirement (markers appear only after pivots are confirmed) and markers are placed on the actual pivot bar for clarity.
Visuals / legend
Teal line: CVD-EMA (smoothed cumulative delta). Rising → net buying pressure; falling → net selling pressure.
Red triangle (above): Bear divergence - price HH vs CVD LH.
Green triangle (below): Bull divergence - price LL vs CVD HL.
No background tint - VDD is a structural order flow tool (markers + CVD line only). Use the VWMA / trend overlays to provide directional context.
Use cases
Detect hidden exhaustion at highs (fade setups) and hidden accumulation at lows (bounce setups).
Confirm or invalidate momentum moves: price rising but CVD falling warns the move lacks order flow support.
Spot campaign-style pressure across a session (session reset) versus multi-day campaigns (disable reset).
Combine with VWMA(50) or higher-TF alignment to filter signals and increase quality.
Defaults
CVD EMA length = 34
Pivot left/right = 5
Reset CVD at session start = ON (recommended for intraday)
Show raw CVD = OFF
Marker size = small (use normal for screenshots)
Example — META (5m, 5-day view)
The 5-day time range 5-minute interval on META shows the pattern VDD is built for: a midday bear divergence (price ticks to a marginal high while the CVD-EMA flattens and then rolls lower) that precedes a multi-hour drift lower, and later bull divergences near intraday lows where the CVD-EMA prints higher lows as price prints lower lows, followed by constructive bounces. With resetSession=ON you can see these flows replay across sessions and judge whether a divergence is isolated or repeated (higher-quality).
Practical tips
Default demo: 5-minute chart on liquid names (META, AAPL, SPY) - lenEMA=34, pivot=5, resetSession=ON.
Scalp: 1m with shorter EMA (e.g., 13) and pivot=3.
Swing / campaign: 4H/Daily with resetSession=OFF and longer EMA (e.g., 89).
Filter with VWMA(50) and require above-average volume at the pivot region for higher-probability signals.
Use alerts (script exposes bear/bull alertconditions) to monitor divergences in real time.
Limitations / disclaimers
Markers are confirmation-based (non-repainting), i.e. they appear after the pivot completes, not as a predictive tick.
No single divergence equals a trade; combine with trend, volume, and risk management.
Part of the Quant Toolkit — transparent, open-source indicators for modern quantitative analysis. Built by CoryP1990.
نص برمجي مفتوح المصدر
بروح TradingView الحقيقية، قام مبتكر هذا النص البرمجي بجعله مفتوح المصدر، بحيث يمكن للمتداولين مراجعة وظائفه والتحقق منها. شكرا للمؤلف! بينما يمكنك استخدامه مجانًا، تذكر أن إعادة نشر الكود يخضع لقواعد الموقع الخاصة بنا.
Quant finance researcher focused on options, volatility modeling, and derivative pricing. Building tools that turn complex market behavior into clear, data-driven insights. Explore analytics and modeling at OptionsAnalysisSuite.com
إخلاء المسؤولية
لا يُقصد بالمعلومات والمنشورات أن تكون، أو تشكل، أي نصيحة مالية أو استثمارية أو تجارية أو أنواع أخرى من النصائح أو التوصيات المقدمة أو المعتمدة من TradingView. اقرأ المزيد في شروط الاستخدام.