Liquidity Raids and Sweeps by Texmoonbeam
The purpose of this indicator is to show you when and where there has been a 'raid' or 'sweep' of this liquidity, meaning a reversal might occur.
The indicator does this by looking for candle wicks, that go beyond a previous pivot high or low.
Settings:
Timeframe – This settings changes the timeframe that the indicator looks for raids/sweeps. Higher timeframes generally mean stronger moves.
Left bars – the number of bars gap higher/lower to the left of a pivot low/high. A higher number means the high or low was formed from a stronger move.
Right bars – the number of bars gap higher/lower to the right of a pivot low/high. A higher number means the high or low started a stronger move.
Max Gap – the maximum number of candles between a raid or sweep. Reduce this number on higher time frames if there are memory errors.
Min Gap – the minimum number of candles between a raid or sweep.
Alerts Wait For Close – If ticked, this means an alert will not be triggered by the current candle wick, overlapping a previous, until the close of that candle. Unticked you will be alerted as soon as the current candle crosses a previous high/low, though it might close far beyond that point and not actually turn out to be a raid/sweep.
Buy Side/Sell Side – line style and colour preferences for buy and sell side.
Strategy:
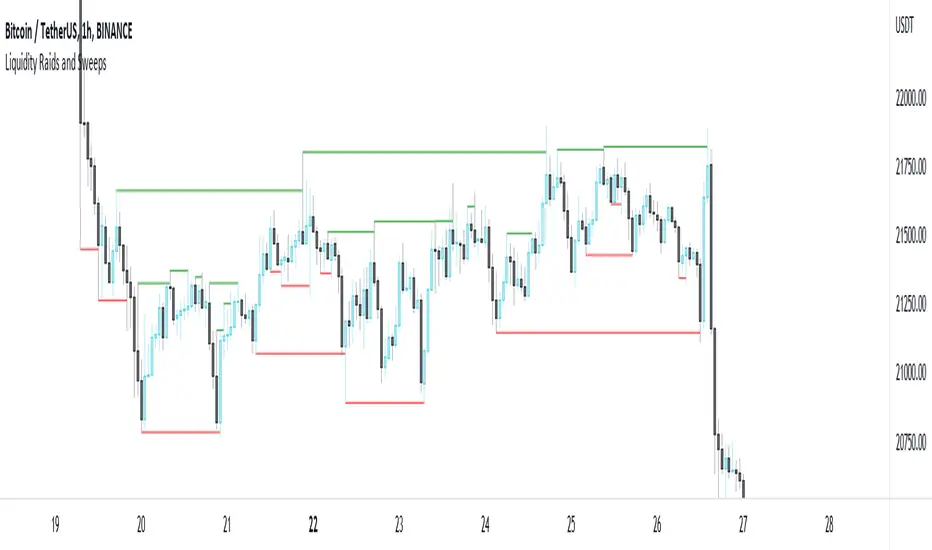
As seen in the example chart, the raid/sweep of liquidity, where only a wick reaches beyond a previous high or low, can be followed by a reversal of direction, often to seek other liquidity targets. This indicator could provide an opportunity to enter a trade at this point and the alert feature means you will be able to set up custom alerts on multiple charts or timeframes.
You should use other confluence and a lower time frame confirmation after a raid/sweep, to identify your entry, stop loss and targets. Familiarity with liquidity and smart money concepts are recommended.
Fixed a bug in the drawing of lines when time frame was set to 'Chart'.
You can now, for example, view raids of the 1 hour time frame, change your chart to m5 and use replay mode to find your entries.
If you want to find raids over a gap larger than 60 bars, you would just use a higher time frame. So a 60 bar gap on 1 hour only requires a 30 bar gap on 2 hour.
نص برمجي للمستخدمين المدعوين فقط
يمكن فقط للمستخدمين الذين تمت الموافقة عليهم من قبل المؤلف الوصول إلى هذا البرنامج النصي. ستحتاج إلى طلب الإذن والحصول عليه لاستخدامه. يتم منح هذا عادةً بعد الدفع. لمزيد من التفاصيل، اتبع تعليمات المؤلف أدناه أو اتصل ب Texmoonbeam مباشرة.
لا توصي TradingView بالدفع مقابل برنامج نصي أو استخدامه إلا إذا كنت تثق تمامًا في مؤلفه وتفهم كيفية عمله. يمكنك أيضًا العثور على بدائل مجانية ومفتوحة المصدر في نصوص مجتمعنا.
تعليمات المؤلف
إخلاء المسؤولية
نص برمجي للمستخدمين المدعوين فقط
يمكن فقط للمستخدمين الذين تمت الموافقة عليهم من قبل المؤلف الوصول إلى هذا البرنامج النصي. ستحتاج إلى طلب الإذن والحصول عليه لاستخدامه. يتم منح هذا عادةً بعد الدفع. لمزيد من التفاصيل، اتبع تعليمات المؤلف أدناه أو اتصل ب Texmoonbeam مباشرة.
لا توصي TradingView بالدفع مقابل برنامج نصي أو استخدامه إلا إذا كنت تثق تمامًا في مؤلفه وتفهم كيفية عمله. يمكنك أيضًا العثور على بدائل مجانية ومفتوحة المصدر في نصوص مجتمعنا.