OPEN-SOURCE SCRIPT
KATIK BankNifty Upside/Downside Levels
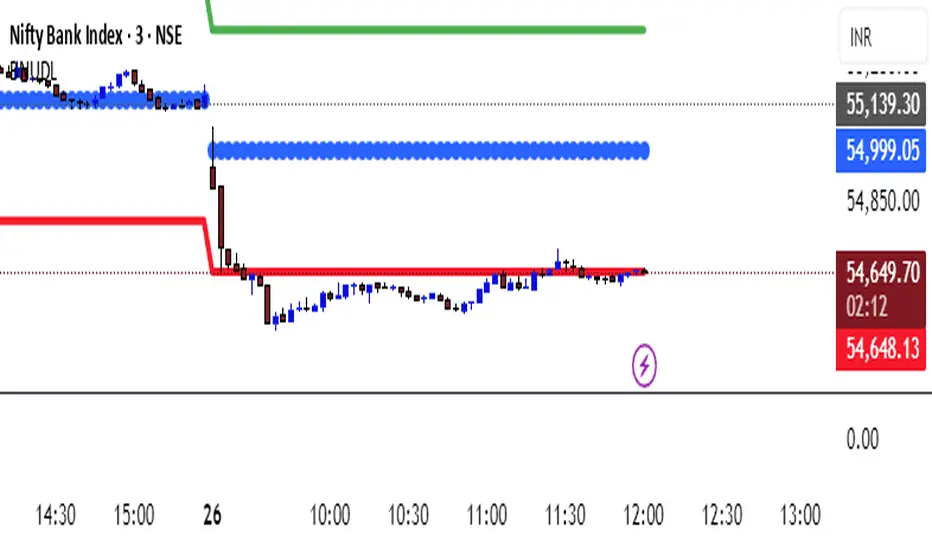
The KATIK BankNifty Upside/Downside Levels (BNUDL) indicator plots key daily reference levels for BankNifty based on its opening price. Using a predefined daily move percentage, it calculates potential upside and downside levels from the open. The script displays:
Up Level (Green): Potential bullish threshold above the open
Down Level (Red): Potential bearish threshold below the open
Open Price (Blue Circles): Daily BankNifty opening level
This tool helps traders quickly identify intraday directional bias and potential support/resistance zones around the opening price.
نص برمجي مفتوح المصدر
بروح TradingView الحقيقية، قام مبتكر هذا النص البرمجي بجعله مفتوح المصدر، بحيث يمكن للمتداولين مراجعة وظائفه والتحقق منها. شكرا للمؤلف! بينما يمكنك استخدامه مجانًا، تذكر أن إعادة نشر الكود يخضع لقواعد الموقع الخاصة بنا.
إخلاء المسؤولية
لا يُقصد بالمعلومات والمنشورات أن تكون، أو تشكل، أي نصيحة مالية أو استثمارية أو تجارية أو أنواع أخرى من النصائح أو التوصيات المقدمة أو المعتمدة من TradingView. اقرأ المزيد في شروط الاستخدام.