OPEN-SOURCE SCRIPT
تم تحديثه Body Gap Detector
This script was inherited from "GAP DETECTOR" by Asch- and the modified version is being published with consent of the author.
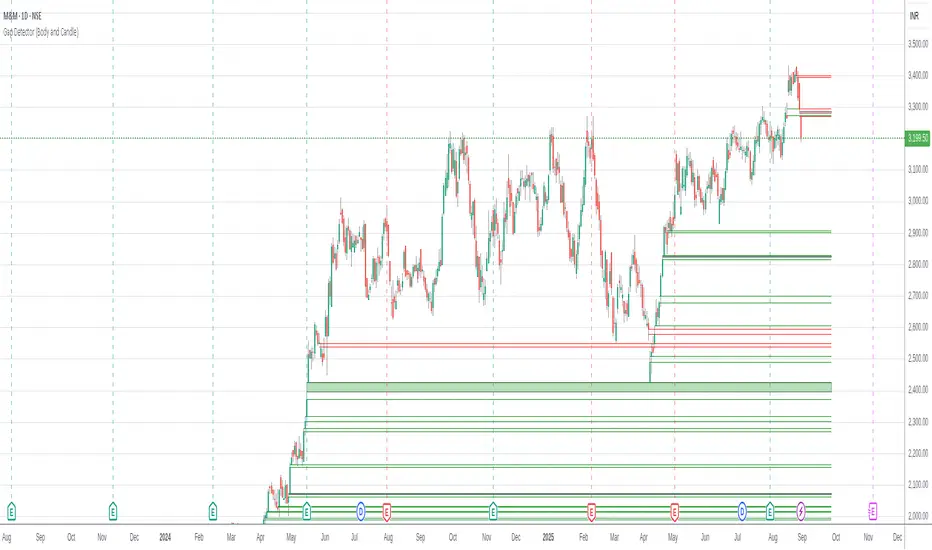
This script identifies gap up or gap down between candle bodies (for the selected time frame). The original script has been reworked to consider Open/Close instead of the High/Low. It identifies "Gap" up/down and indicates them with markers drawn from "Open/Close" of one candle to the "Close/Open" of another.
The default setting is to consider the last 1500 candles. "Gap Up" is indicated by Green bars and "Gap Down" is indicated with Red bars.
ملاحظات الأخبار
Name change.ملاحظات الأخبار
Performance update. Can traverse up to 5000 candles in history (depending on system capabilities). Resolves the "Script took more than 200ms" error for most of the charts.ملاحظات الأخبار
Performance fix to save time in loops. Can traverse up to 5000 candles in history (depending on system capabilities). Resolves the "Script took more than 200ms" error for most of the charts.ملاحظات الأخبار
Performance enhancements. Moved default candle count to 3000 (max: 5000).Note: Observed on a couple of occasions (w.r.t stock indexes), the script missed a couple of recent gaps. Please (re)validate your charts visually.
ملاحظات الأخبار
Bug fixes to accurately detect gaps. Added few more comments for clarity.ملاحظات الأخبار
Fixing chart display.ملاحظات الأخبار
Revamped design and code for performanceFinds/Detects gaps between candles and candle bodies for any chart/timeframe with O(n+delta) performance.
Candle Gaps (between wicks) act as strong support or resistance. They are drawn as solid boxes.
Body Gaps (ignores wicks) act as mild support or resistance. They are depicted with lines.
Adjust the settings for candle/body gap width, smaller the time frame, smaller the gap.
Adjust max historical bars to fine tune performance on your system/setup. The more historical bars the script scans, more time required to load the chart. At times based on system configuration, TradingView may timeout the script due to too many bars. Reducing the max bars helps in this scenario.
Happy charting !
نص برمجي مفتوح المصدر
بروح TradingView الحقيقية، قام مبتكر هذا النص البرمجي بجعله مفتوح المصدر، بحيث يمكن للمتداولين مراجعة وظائفه والتحقق منها. شكرا للمؤلف! بينما يمكنك استخدامه مجانًا، تذكر أن إعادة نشر الكود يخضع لقواعد الموقع الخاصة بنا.
إخلاء المسؤولية
لا يُقصد بالمعلومات والمنشورات أن تكون، أو تشكل، أي نصيحة مالية أو استثمارية أو تجارية أو أنواع أخرى من النصائح أو التوصيات المقدمة أو المعتمدة من TradingView. اقرأ المزيد في شروط الاستخدام.