OPEN-SOURCE SCRIPT
تم تحديثه Velocity + Momentum (SMA-Based)

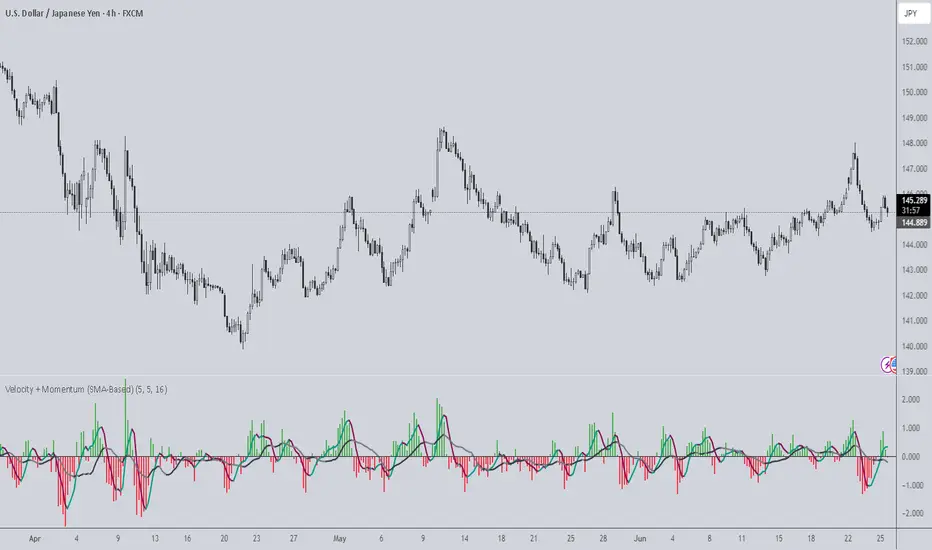
Velocity + Momentum (SMA-Based) is a clean, powerful oscillator that measures price acceleration using SMA-derived velocity and dual momentum signals. This tool is ideal for identifying directional shifts, exhaustion points, and early entries across any market or timeframe.
How It Works:
This indicator calculates velocity as the distance between the current close and a simple moving average of the open price. Then, it applies two smoothed moving averages to this velocity line:
• Internal Momentum (shorter-term smoothing)
• External Momentum (longer-term context, hidden by default)
The result is a layered view of how fast price is moving and whether that move is gaining or losing strength.
How to Use:
• The green/red histogram shows current velocity (positive = bullish, negative = bearish)
• The teal/maroon line tracks internal momentum and provides short-term signal turns
• The black/gray (hidden) line reflects external momentum and supports broader trend alignment
• Watch for crosses above/below the zero line for confirmation of directional strength
• Use the built-in alerts to catch real-time shifts in all three layers of movement: velocity, internal, and external
Why It's Useful:
• Detects subtle transitions before price structure changes
• Helps filter out noise by comparing short-term vs long-term motion
• Ideal for scalpers, swing traders, and trend-followers alike
• Pairs well with structure-based tools or price action zones
• Works on any asset and timeframe
This indicator simplifies momentum analysis by giving you actionable, multi-layered feedback on how price is accelerating — and when that’s likely to reverse.
ملاحظات الأخبار
New mode added- SMA Extremity. Better for timing bare candle velocity/momentumنص برمجي مفتوح المصدر
بروح TradingView الحقيقية، قام مبتكر هذا النص البرمجي بجعله مفتوح المصدر، بحيث يمكن للمتداولين مراجعة وظائفه والتحقق منها. شكرا للمؤلف! بينما يمكنك استخدامه مجانًا، تذكر أن إعادة نشر الكود يخضع لقواعد الموقع الخاصة بنا.
إخلاء المسؤولية
لا يُقصد بالمعلومات والمنشورات أن تكون، أو تشكل، أي نصيحة مالية أو استثمارية أو تجارية أو أنواع أخرى من النصائح أو التوصيات المقدمة أو المعتمدة من TradingView. اقرأ المزيد في شروط الاستخدام.
نص برمجي مفتوح المصدر
بروح TradingView الحقيقية، قام مبتكر هذا النص البرمجي بجعله مفتوح المصدر، بحيث يمكن للمتداولين مراجعة وظائفه والتحقق منها. شكرا للمؤلف! بينما يمكنك استخدامه مجانًا، تذكر أن إعادة نشر الكود يخضع لقواعد الموقع الخاصة بنا.
إخلاء المسؤولية
لا يُقصد بالمعلومات والمنشورات أن تكون، أو تشكل، أي نصيحة مالية أو استثمارية أو تجارية أو أنواع أخرى من النصائح أو التوصيات المقدمة أو المعتمدة من TradingView. اقرأ المزيد في شروط الاستخدام.