PROTECTED SOURCE SCRIPT
Composite RSI2/9

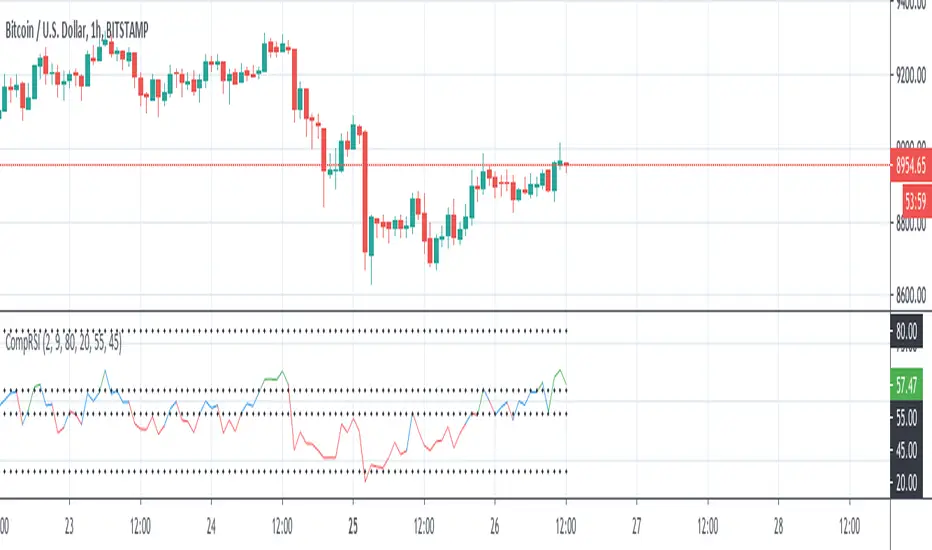
Composite RSI is a new way of calculating the RSI. Unlike the RSI that is a sort of a momentum indicator, composite RSI2/9 is more a trending indicator. It tends to filter out insignificant price changes and seems to be good in identifying the underlying trends.
This indicator shows the average RSI between two periods (default values are 2 and 9) considering the same for multiple timeframes.
For example if the average between RSI2 and RSI9 for 1H and 4H is crssed below static sell level (values is adjustable) it could be read as a signal of down trend.
I suggets to use with higher timeframe.
نص برمجي محمي
تم نشر هذا النص البرمجي كمصدر مغلق. ومع ذلك، يمكنك استخدامه بحرية ودون أي قيود - تعرف على المزيد هنا.
إخلاء المسؤولية
لا يُقصد بالمعلومات والمنشورات أن تكون، أو تشكل، أي نصيحة مالية أو استثمارية أو تجارية أو أنواع أخرى من النصائح أو التوصيات المقدمة أو المعتمدة من TradingView. اقرأ المزيد في شروط الاستخدام.