OPEN-SOURCE SCRIPT
Mocker Market Mean Indicator
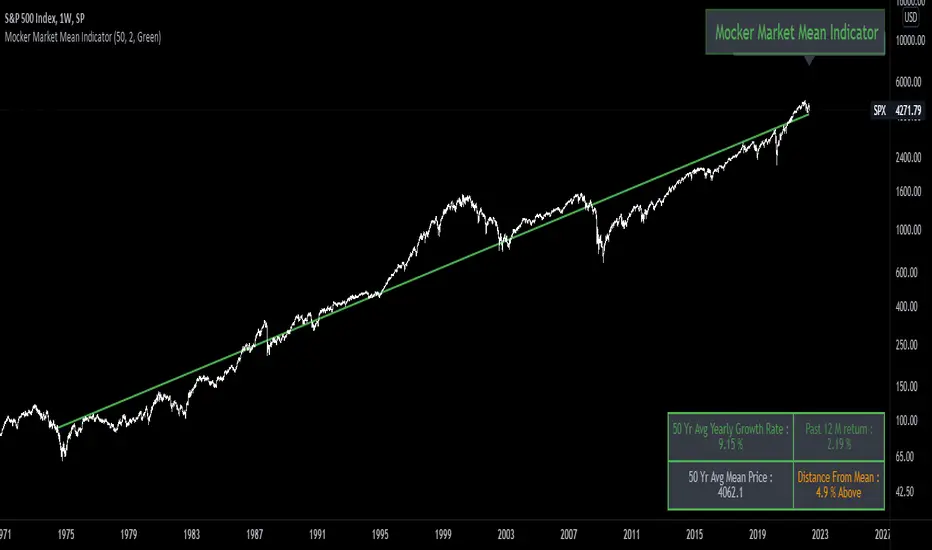
The objective of this indicator is to find the historical mean price of a market ( Intended for Indexes or ETF's). Based off of the concept that Benjamin Graham taught, that Mr. Market is a manic depressive forever oscillating between unjustified pessimism to extreme optimism. The intent of this indicator is to supplement a regular allocation strategy to an index or ETF , to increase that allocation when it's trading below its historical mean and decrease when trading above. It does this by using an exponential regression model to find the closest approximation of the current mean price based on past growth rate, and user defined lookback period.
نص برمجي مفتوح المصدر
بروح TradingView الحقيقية، قام مبتكر هذا النص البرمجي بجعله مفتوح المصدر، بحيث يمكن للمتداولين مراجعة وظائفه والتحقق منها. شكرا للمؤلف! بينما يمكنك استخدامه مجانًا، تذكر أن إعادة نشر الكود يخضع لقواعد الموقع الخاصة بنا.
إخلاء المسؤولية
لا يُقصد بالمعلومات والمنشورات أن تكون، أو تشكل، أي نصيحة مالية أو استثمارية أو تجارية أو أنواع أخرى من النصائح أو التوصيات المقدمة أو المعتمدة من TradingView. اقرأ المزيد في شروط الاستخدام.