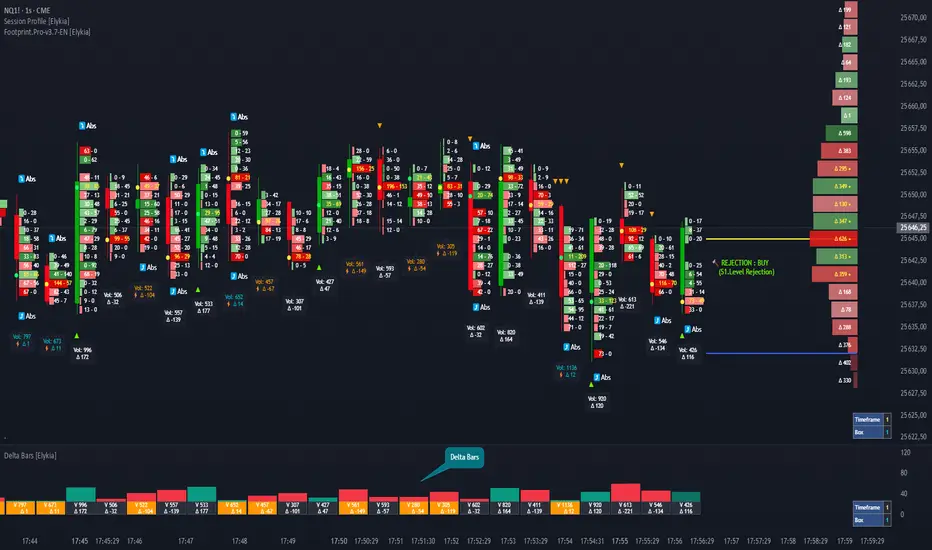
Delta Bars [Elykia]
Description:
Delta Bars [Elykia] is an "Order Flow Oscillator" designed to instantly visualize buyer and seller aggression within every price move.
Unlike standard volume, it breaks down what is happening "under the hood" (Delta) and offers a clear reading of market reversals thanks to intelligent divergence detection.
🔥 Key Features:
1. Dual Calculation Mode:
- Timeframe Mode: Displays classic Delta based on time (e.g., 1min, 5min).
- Range Bars Mode: (Exclusive) Builds Delta bars based on price movement (volatility) rather than time. This filters out noise during consolidation periods and reveals true strength during impulses.
2. 🧠 Smart Auto-Detection (Plug & Play):
No need to manually calculate "Box" or "Tick" sizes for each asset. The indicator automatically recognizes the asset you are trading and applies the optimal institutional calibration:
- US Indices (NQ, ES, YM...)
- Forex (EURUSD, JPY...)
- Crypto (BTC, ETH)
- Commodities (Gold, Oil)
- Note: You can still switch to manual mode if needed.
3. "Flip" Detection (Divergences) ⚡:
The indicator automatically identifies anomalies between price and Delta:
- If the candle closes Green but Delta is Negative (Absorption/Failed Selling Effort).
- If the candle closes Red but Delta is Positive.
- These situations are marked with a ⚡ symbol and a specific highlight color (Orange by default), often signaling an imminent reversal.
4. Technical Dashboard:
A discreet panel displays the current mode and "Box" size (in ticks/points) in real-time, ensuring you always know how the data is being filtered.
How to read the signals?
1. Green/Red Bars: They indicate Net Delta (the difference between buying and selling volume). A tall bar implies strong conviction.
2. The ⚡ Symbol (The Flip): This is the most critical signal. It appears when Delta contradicts the candle direction (e.g., Positive Delta on a Bearish candle). This indicates Absorption (passive orders blocking the move) and often precedes a reversal.
3. Range Bars Mode: Use this mode to "smooth out" the market. If the market is choppy, Range Bars will filter the noise and only draw a new bar if the price actually moves.
⚠️ Important: Replay Mode
Since this indicator performs heavy calculations (simulated tick-by-tick), it includes a safety feature for Replay Mode.
- To use Replay: Go to settings and set the "Force Replay Date" to a date close to your starting point. This ensures maximum fluidity and avoids TradingView limit errors.
Configuration:
- Works on all timeframes but excels on seconds charts (1s, 5s) or fast minute charts (1m) for scalping.
نص برمجي للمستخدمين المدعوين فقط
يمكن فقط للمستخدمين الذين تمت الموافقة عليهم من قبل المؤلف الوصول إلى هذا البرنامج النصي. ستحتاج إلى طلب الإذن والحصول عليه لاستخدامه. يتم منح هذا عادةً بعد الدفع. لمزيد من التفاصيل، اتبع تعليمات المؤلف أدناه أو اتصل ب Elykia34 مباشرة.
لا توصي TradingView بالدفع مقابل برنامج نصي أو استخدامه إلا إذا كنت تثق تمامًا في مؤلفه وتفهم كيفية عمله. يمكنك أيضًا العثور على بدائل مجانية ومفتوحة المصدر في نصوص مجتمعنا.
تعليمات المؤلف
إخلاء المسؤولية
نص برمجي للمستخدمين المدعوين فقط
يمكن فقط للمستخدمين الذين تمت الموافقة عليهم من قبل المؤلف الوصول إلى هذا البرنامج النصي. ستحتاج إلى طلب الإذن والحصول عليه لاستخدامه. يتم منح هذا عادةً بعد الدفع. لمزيد من التفاصيل، اتبع تعليمات المؤلف أدناه أو اتصل ب Elykia34 مباشرة.
لا توصي TradingView بالدفع مقابل برنامج نصي أو استخدامه إلا إذا كنت تثق تمامًا في مؤلفه وتفهم كيفية عمله. يمكنك أيضًا العثور على بدائل مجانية ومفتوحة المصدر في نصوص مجتمعنا.