BITCOINDICATOR Range Finder
Eliminates the need to manually draw trend lines and add price labels.
How to use:
Adjust the "Draw support/resistance from how many bars back" inputs to find an accurate trading range according to your timeframe and trading strategy.
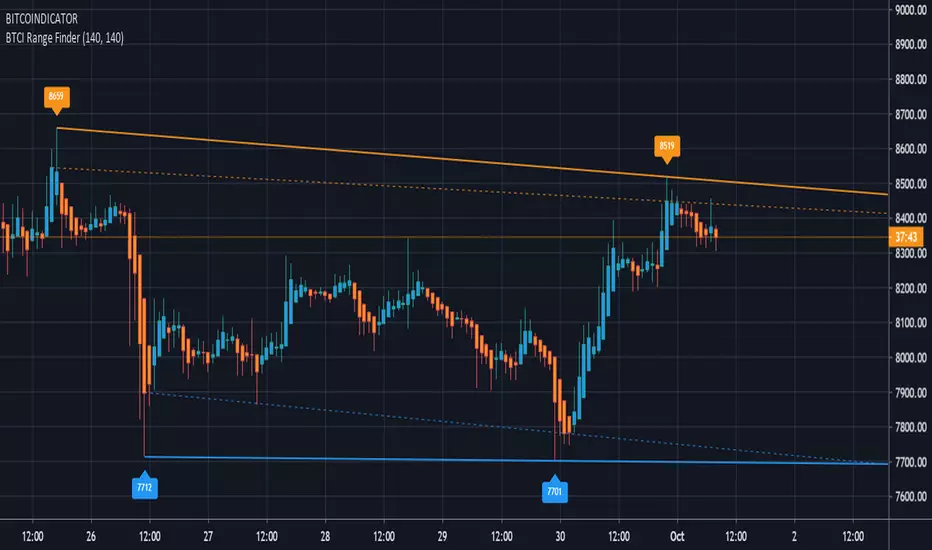
Example (chart above): Bars back values are both set to 140. The left resistance label "8659" targets the "high" of the upper half of the bars back input (71-140). The right resistance label "8519" targets the "high" of the lower half of the input (0-70). The supports work the same way but target the "lows".
The dotted lines are drawn from the two "highest closes" (resistance) and the two "lowest closes" (support) over the same input range and can be used to create support & resistance zones.
Side note: the colored bars come from the BITCOINDICATOR indicator with the labels and symbols removed.
This indicator works for ANY chart and all markets.
*The Bitcoindicator Range Finder is part of the Bitcoindicator package.
For detailed information on Bitcoindicator and how to add it to your charts, please visit:
https://www.bitcoindicator.com
نص برمجي للمستخدمين المدعوين فقط
يمكن فقط للمستخدمين الذين تمت الموافقة عليهم من قبل المؤلف الوصول إلى هذا البرنامج النصي. ستحتاج إلى طلب الإذن والحصول عليه لاستخدامه. يتم منح هذا عادةً بعد الدفع. لمزيد من التفاصيل، اتبع تعليمات المؤلف أدناه أو اتصل ب IndicatorKing مباشرة.
لا توصي TradingView بالدفع مقابل برنامج نصي أو استخدامه إلا إذا كنت تثق تمامًا في مؤلفه وتفهم كيفية عمله. يمكنك أيضًا العثور على بدائل مجانية ومفتوحة المصدر في نصوص مجتمعنا.
تعليمات المؤلف
إخلاء المسؤولية
نص برمجي للمستخدمين المدعوين فقط
يمكن فقط للمستخدمين الذين تمت الموافقة عليهم من قبل المؤلف الوصول إلى هذا البرنامج النصي. ستحتاج إلى طلب الإذن والحصول عليه لاستخدامه. يتم منح هذا عادةً بعد الدفع. لمزيد من التفاصيل، اتبع تعليمات المؤلف أدناه أو اتصل ب IndicatorKing مباشرة.
لا توصي TradingView بالدفع مقابل برنامج نصي أو استخدامه إلا إذا كنت تثق تمامًا في مؤلفه وتفهم كيفية عمله. يمكنك أيضًا العثور على بدائل مجانية ومفتوحة المصدر في نصوص مجتمعنا.