OPEN-SOURCE SCRIPT
Bollinger Bands + Supertrend by Xoediac
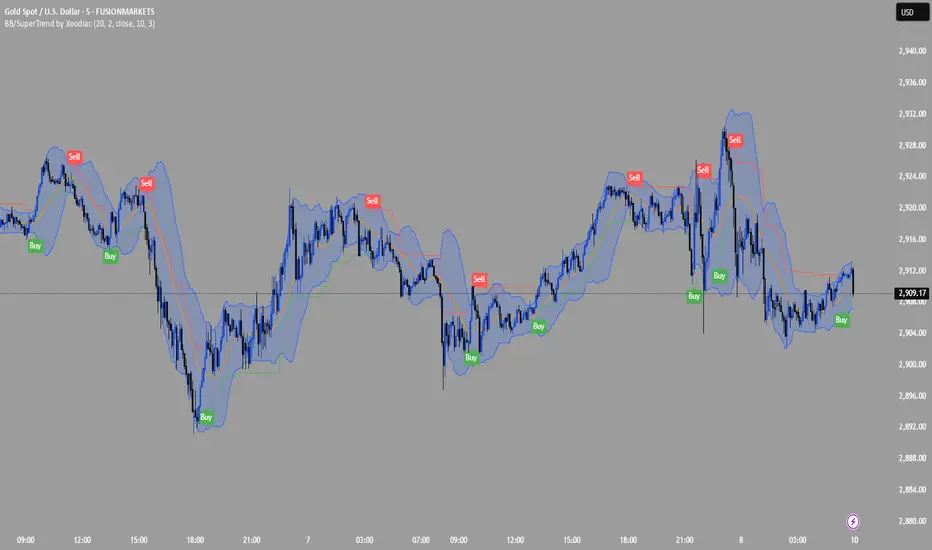
Bollinger Bands with Supertrend Indicator by Xeodiac
This script combines two powerful technical analysis tools — Bollinger Bands and the Supertrend Indicator — to provide traders with a comprehensive view of market volatility and trend direction.
Bollinger Bands: These bands consist of a middle band (the simple moving average, or SMA) and two outer bands (calculated as standard deviations away from the middle). The upper and lower bands act as dynamic support and resistance levels, expanding during high volatility and contracting during low volatility.
Supertrend Indicator: The Supertrend is a trend-following indicator that uses the Average True Range (ATR) to calculate an adaptive threshold, indicating whether the market is in an uptrend or downtrend. The indicator changes color based on the trend direction, providing clear buy and sell signals.
Features of the Script:
Volatility-based Signals: By incorporating the Bollinger Bands, the script adjusts to market volatility. Traders can identify periods of high and low volatility, helping to gauge potential price breakouts or reversals.
Trend Confirmation: The Supertrend helps confirm the trend direction, ensuring that trades are aligned with the overall market trend. Green Supertrend signals indicate an uptrend, while red signals indicate a downtrend.
Enhanced Decision-making: By using both indicators together, traders can make more informed decisions. For instance, buying opportunities are validated when the price is near the lower Bollinger Band, and the Supertrend is in a bullish phase, and vice versa for selling.
Customizable Parameters: The script allows users to customize the settings for both the Bollinger Bands and the Supertrend, enabling fine-tuning based on trading preferences or market conditions.
Ideal Use Cases:
Identifying trend reversals or continuation patterns in trending markets.
Monitoring price action during periods of low volatility for breakout opportunities.
Filtering out false signals by combining volatility with trend strength.
نص برمجي مفتوح المصدر
بروح TradingView الحقيقية، قام مبتكر هذا النص البرمجي بجعله مفتوح المصدر، بحيث يمكن للمتداولين مراجعة وظائفه والتحقق منها. شكرا للمؤلف! بينما يمكنك استخدامه مجانًا، تذكر أن إعادة نشر الكود يخضع لقواعد الموقع الخاصة بنا.
إخلاء المسؤولية
لا يُقصد بالمعلومات والمنشورات أن تكون، أو تشكل، أي نصيحة مالية أو استثمارية أو تجارية أو أنواع أخرى من النصائح أو التوصيات المقدمة أو المعتمدة من TradingView. اقرأ المزيد في شروط الاستخدام.