OPEN-SOURCE SCRIPT
Chervolinos-Wave-PM-Forecast
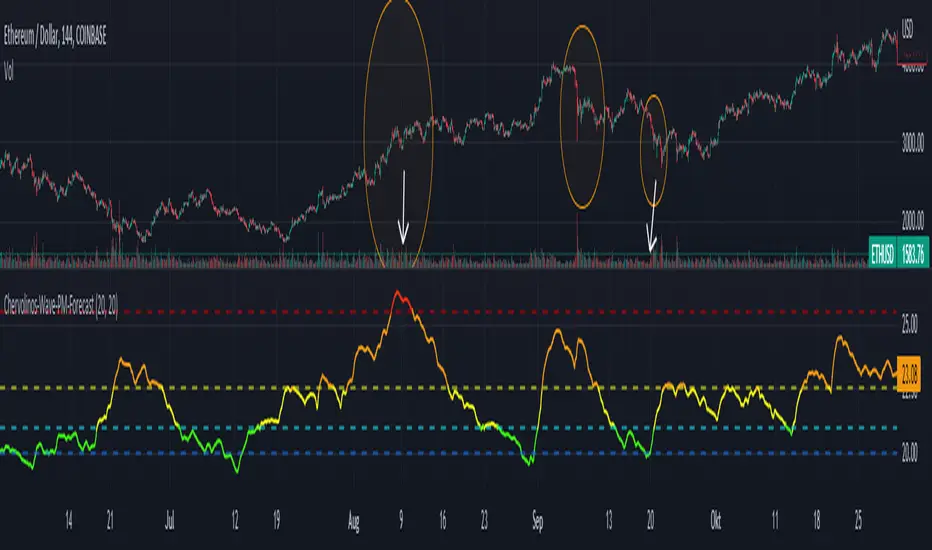
The Wave PM (Whistler Active Volatility Energy – Price Mass) indicator is an oscillator described in Mark Whistler's book, Volatility Illuminated.
The Wave PM is specifically designed to help read volatility cycles. When we visualize volatility cycles as a chart, we can get a clear view of the market volatility phases in multiple time frames. This indicator forms an arithmetic mean over 30 observed periods. Traders can thus get a better insight into "potential" volatility from up to pent-up energy, the different zones give strong help to predict future price developments.
Possible interpretation patterns:
You are at the end of a long uptrend and you want to know if the price is going to go down, if the indicator shows red and the value is above 25, it is likely to do so.
You're in a downtrend and there's a bit of a recovery phase, so you might be wondering if it's going to continue when the indicator shows green. It would go further with yellow, but with green it can be assumed that it is going down rapidly.
Special thanks to sourcey who programmed the 3D Wave-PM.
This variant of sourcey looks very nice, but was too confusing for me. In order to get a strong overview, forming an arithmetic mean is very useful.
I hope you and the Mods like my version
Best regards, Chervolino
نص برمجي مفتوح المصدر
بروح TradingView الحقيقية، قام مبتكر هذا النص البرمجي بجعله مفتوح المصدر، بحيث يمكن للمتداولين مراجعة وظائفه والتحقق منها. شكرا للمؤلف! بينما يمكنك استخدامه مجانًا، تذكر أن إعادة نشر الكود يخضع لقواعد الموقع الخاصة بنا.
إخلاء المسؤولية
لا يُقصد بالمعلومات والمنشورات أن تكون، أو تشكل، أي نصيحة مالية أو استثمارية أو تجارية أو أنواع أخرى من النصائح أو التوصيات المقدمة أو المعتمدة من TradingView. اقرأ المزيد في شروط الاستخدام.