PROTECTED SOURCE SCRIPT
تم تحديثه Wolf Alerts Signals
Wolf Alerts Signals
This is an indicator of possible market entry.
Indicates with an arrow the direction and with a letter the intensity ("H" High or "L" Low).
Everything is calculated by comparing RSI and Volumes.
produced by zstiziano
This is an indicator of possible market entry.
Indicates with an arrow the direction and with a letter the intensity ("H" High or "L" Low).
Everything is calculated by comparing RSI and Volumes.
produced by zstiziano
ملاحظات الأخبار
Adjustment of short values.ملاحظات الأخبار
Update ملاحظات الأخبار
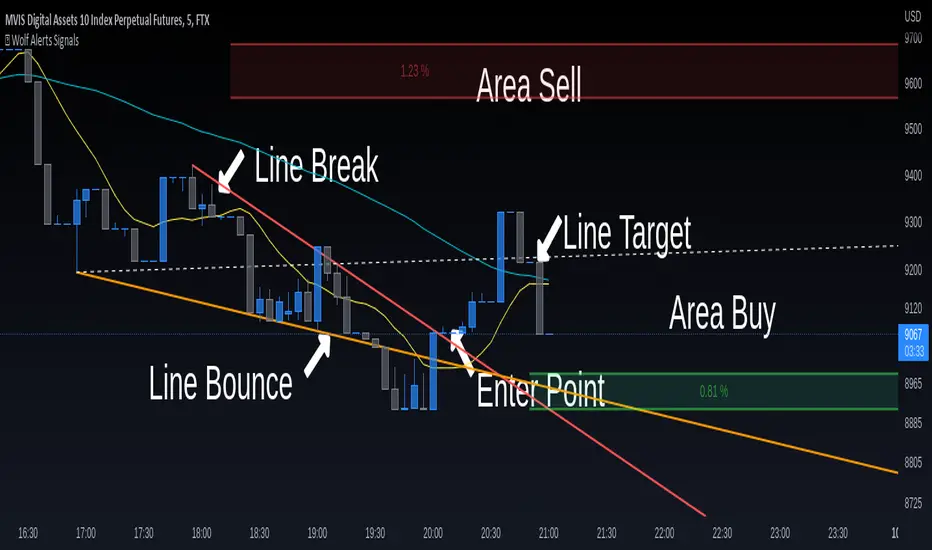
This indicator helps you find:- trend direction thanks to 3 moving averages
- breaking points of the trend lines
- buying and selling areas with the highest trade
- signals of too much sold or too much bought
Help this project with a small donation:
https://www.paypal.com/donate/?hosted_button_id=XFWT7XME5DRFE
ملاحظات الأخبار
EXAMPLE LONG
EXAMPLE SHORT
▬▬▬▬▬▬▬▬▬▬▬▬▬▬▬▬▬▬▬▬▬▬▬▬▬▬▬▬▬▬▬▬▬▬▬
SUPPORT THIS PROJECT
▬▬▬▬▬▬▬▬▬▬▬▬▬▬▬▬▬▬▬▬▬▬▬▬▬▬▬▬▬▬▬▬▬▬▬
💰 [url= paypal.com/donate/?hosted_button_id=XFWT7XME5DRFE ] paypal.com/donate/?hosted_button_id=XFWT7XME5DRFE 💰
ملاحظات الأخبار
fix bugملاحظات الأخبار
- fix trend line- add line target
▬▬▬▬▬▬▬▬▬▬▬▬▬▬▬▬▬▬▬▬▬▬▬▬▬▬▬▬▬▬▬▬▬▬▬
SUPPORT THIS PROJECT
💰 DONATE WITH PAYPAL 💰
[url= paypal.com/donate/?hosted_button_id=XFWT7XME5DRFE ] paypal.com/donate/?hosted_button_id=XFWT7XME5DRFE ▬▬▬▬▬▬▬▬▬▬▬▬▬▬▬▬▬▬▬▬▬▬▬▬▬▬▬▬▬▬▬▬▬▬▬
ملاحظات الأخبار
- added the possibility to choose whether to consider the shadow or not
ملاحظات الأخبار
- Add second line for target
- Add line day Open, High, Low
- Add select moving average type
نص برمجي محمي
تم نشر هذا النص البرمجي كمصدر مغلق. ومع ذلك، يمكنك استخدامه بحرية ودون أي قيود - تعرف على المزيد هنا.
إخلاء المسؤولية
لا يُقصد بالمعلومات والمنشورات أن تكون، أو تشكل، أي نصيحة مالية أو استثمارية أو تجارية أو أنواع أخرى من النصائح أو التوصيات المقدمة أو المعتمدة من TradingView. اقرأ المزيد في شروط الاستخدام.