OPEN-SOURCE SCRIPT
Weekly Box
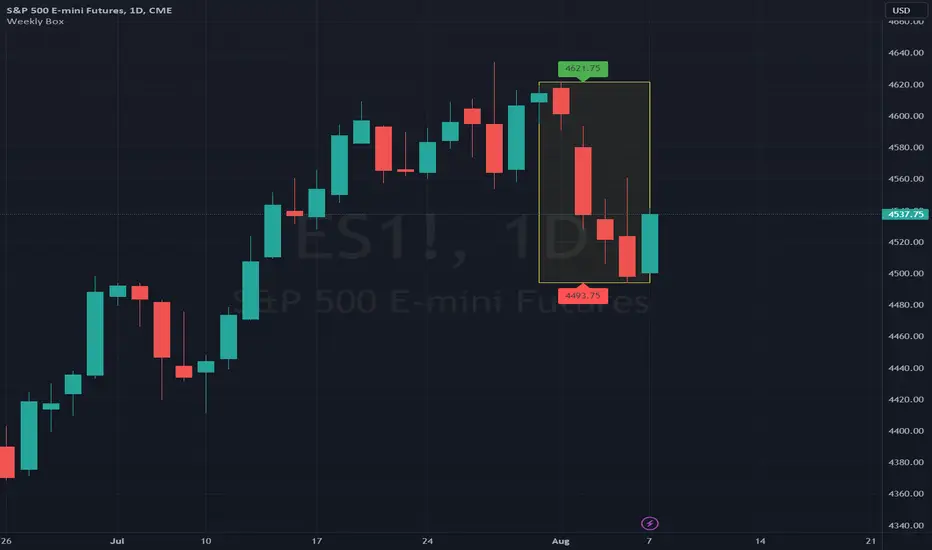
The indicator shows a box based on the high and low of the previous week that extends into the current week. The box is used to monitor breakouts or break downs of the price with respect to the previous week levels.
The box is colored:
- green, if there is a breakout above the previous week high; or
- red, if there is a break down below the previous week low; or
- yellow, if the price stays inside of the box.
during the current week.
Labels for the box top and bottom prices can be enabled or disabled in the settings.
نص برمجي مفتوح المصدر
بروح TradingView الحقيقية، قام مبتكر هذا النص البرمجي بجعله مفتوح المصدر، بحيث يمكن للمتداولين مراجعة وظائفه والتحقق منها. شكرا للمؤلف! بينما يمكنك استخدامه مجانًا، تذكر أن إعادة نشر الكود يخضع لقواعد الموقع الخاصة بنا.
إخلاء المسؤولية
لا يُقصد بالمعلومات والمنشورات أن تكون، أو تشكل، أي نصيحة مالية أو استثمارية أو تجارية أو أنواع أخرى من النصائح أو التوصيات المقدمة أو المعتمدة من TradingView. اقرأ المزيد في شروط الاستخدام.