OPEN-SOURCE SCRIPT
Abdullah
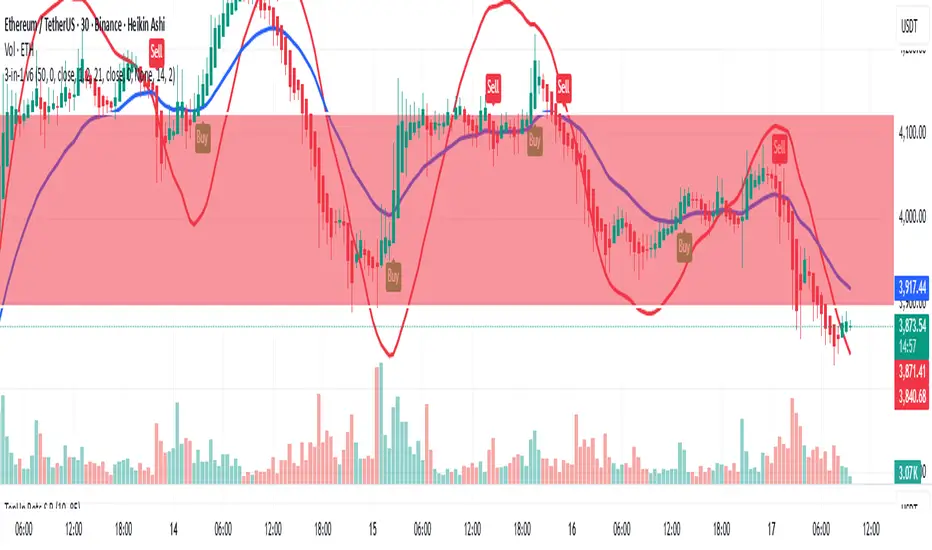
This script is a **3-in-1 Combined Indicator** for Pine Script v6, merging three popular technical analysis tools into a single chart overlay. It's designed to provide a comprehensive view of trend direction, momentum, and volatility-based stops.
Here's a breakdown of the three components:
## 1. ZLSMA - Zero Lag LSMA (Zero Lag Least Squares Moving Average)
The ZLSMA is a fast-reacting moving average that aims to eliminate the lag typically associated with standard moving averages. It does this by calculating the difference between a standard **Least Squares Moving Average (LSMA)** and a smoothed version of that LSMA, then adding that difference back to the original LSMA.
* **Customizable Inputs:** Length, Offset, and Source Price.
* **Plot:** A thick yellow line indicating the zero-lag trend.
---
## 2. Chandelier Exit
The Chandelier Exit is a volatility-based tool that places a trailing stop either above the price (for a long trade exit) or below the price (for a short trade exit). It uses the **Average True Range (ATR)** to set the stop distance.
* **Key Function:** Identifies potential stop-loss levels and trend changes.
* **Customizable Inputs:** ATR Period, ATR Multiplier, and an option to use the Close price for extremum calculations.
* **Visuals:**
* Plots the **Long Stop (Green)** and **Short Stop (Red)** lines, which switch based on the current trend direction.
* Optional **Buy/Sell Labels** and **Highlighting** (shaded background) to clearly mark the current trend state (long or short).
---
## 3. Exponential Moving Average (EMA) with Optional Smoothing Bands
This section plots a standard **Exponential Moving Average (EMA)** and includes a unique feature to smooth the EMA's output using another moving average or Bollinger Bands.
* **EMA Plot:** A blue line representing the EMA, with customizable Length, Source, and Offset.
* **Optional Smoothing:** The EMA line itself can be smoothed by applying a secondary moving average (SMA, EMA, WMA, etc.) to the EMA's values.
* **Bollinger Bands Option:** If **SMA + Bollinger Bands** is selected for smoothing, it plots **Upper** and **Lower Bands** based on the standard deviation of the EMA, providing a visual envelope for volatility around the smoothed line.
نص برمجي مفتوح المصدر
بروح TradingView الحقيقية، قام مبتكر هذا النص البرمجي بجعله مفتوح المصدر، بحيث يمكن للمتداولين مراجعة وظائفه والتحقق منها. شكرا للمؤلف! بينما يمكنك استخدامه مجانًا، تذكر أن إعادة نشر الكود يخضع لقواعد الموقع الخاصة بنا.
إخلاء المسؤولية
لا يُقصد بالمعلومات والمنشورات أن تكون، أو تشكل، أي نصيحة مالية أو استثمارية أو تجارية أو أنواع أخرى من النصائح أو التوصيات المقدمة أو المعتمدة من TradingView. اقرأ المزيد في شروط الاستخدام.