PROTECTED SOURCE SCRIPT
Red Dog Reversal Pattern
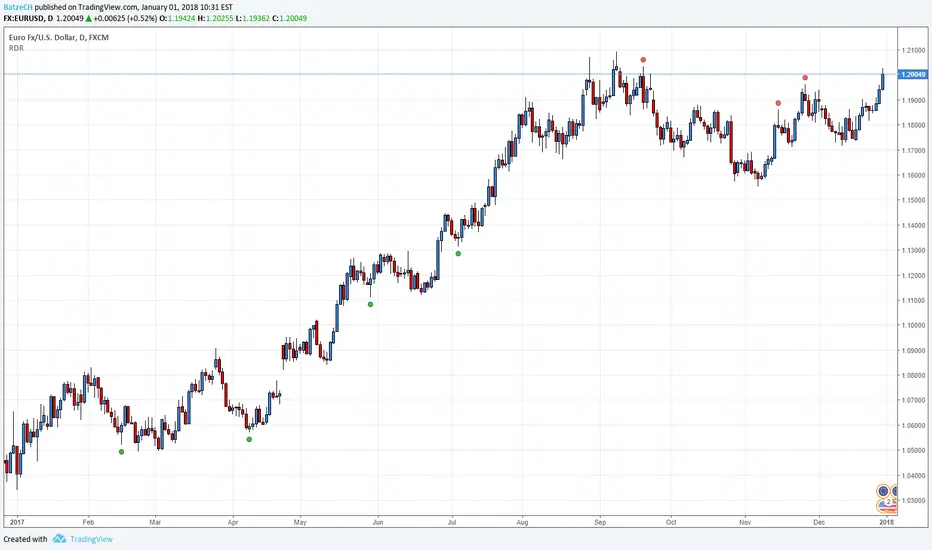
This indicator is a interpretation of the Red Dog Reversal Pattern which was discovered by T3Live founder Scott Redler. (AFAIK)
The indicator is maybe useful for Day Trade or Swing Trade.
BUY Criteria:
1. Stock is down for multiple days
2. Stock goes below prior day's low
3. Stock trades back up through prior day's low, which triggers the buy
4. The stop is set at the current intraday low
SELL Criteria:
1. Stock is up for multiple days
2. Stock goes above the prior day's high
3. Stock trades back down through prior day's high, which triggers the sell
4. The stop is set at the current intraday high
Please always remember, there is no holy grail indicator!
نص برمجي محمي
تم نشر هذا النص البرمجي كمصدر مغلق. ومع ذلك، يمكنك استخدامه بحرية ودون أي قيود - تعرف على المزيد هنا.
إخلاء المسؤولية
لا يُقصد بالمعلومات والمنشورات أن تكون، أو تشكل، أي نصيحة مالية أو استثمارية أو تجارية أو أنواع أخرى من النصائح أو التوصيات المقدمة أو المعتمدة من TradingView. اقرأ المزيد في شروط الاستخدام.