OPEN-SOURCE SCRIPT
Volume x Price in Crores + RVol
Script is designed predominantly for Indian users. Many are used to looking at numbers in lakhs and crores vs millions and billions, this provides a volume figure in rupee crores.
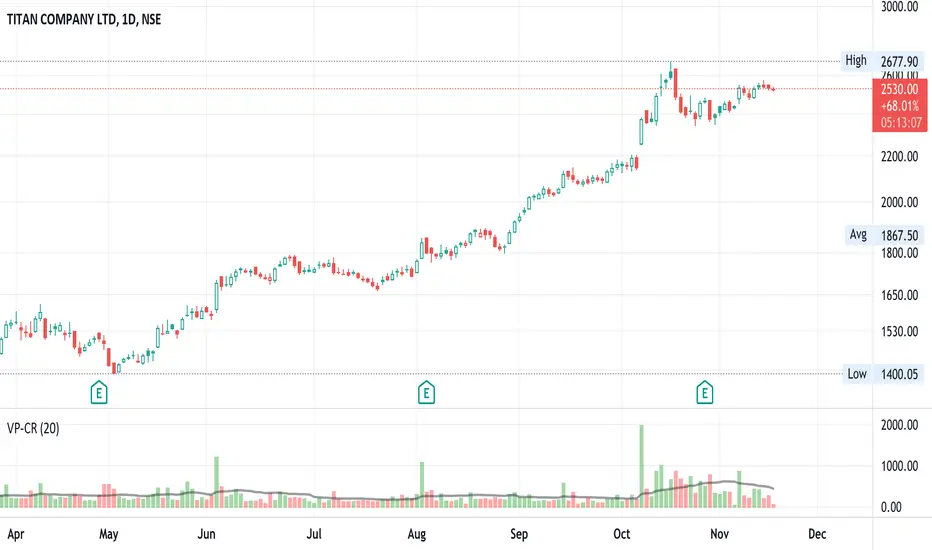
Formula is last close_price x volume / 1 cr or (close_price x volume /10000000). The second figure is the simple moving average (default to 20sma ) again in rupee crores. The third is the relative volume - todays volume / 20 day moving average.
Helpful especially when putting on a trade for a thinly traded stock. It is a quick gauge to how large or small one would want to buy or avoid. Helps manage risk. Also, great to see large volumes in crores to gauge institutional buys or sells.
On 10/NOV/21 - In the chart displayed here, Titan volumes are on average quite substantial as one can see. The 20 day moving average is 550 CR+. 10/NOV volumes are shown as 226 CR and the RVOL is 0.41 (226/550).
نص برمجي مفتوح المصدر
بروح TradingView الحقيقية، قام مبتكر هذا النص البرمجي بجعله مفتوح المصدر، بحيث يمكن للمتداولين مراجعة وظائفه والتحقق منها. شكرا للمؤلف! بينما يمكنك استخدامه مجانًا، تذكر أن إعادة نشر الكود يخضع لقواعد الموقع الخاصة بنا.
إخلاء المسؤولية
لا يُقصد بالمعلومات والمنشورات أن تكون، أو تشكل، أي نصيحة مالية أو استثمارية أو تجارية أو أنواع أخرى من النصائح أو التوصيات المقدمة أو المعتمدة من TradingView. اقرأ المزيد في شروط الاستخدام.