OPEN-SOURCE SCRIPT
Exponential growth
Purpose
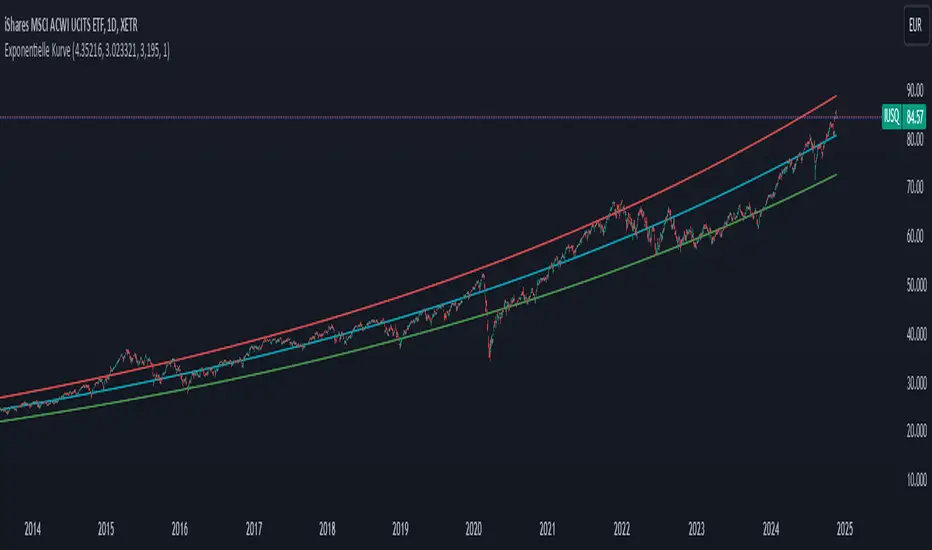
The indicator plots an exponential curve based on historical price data and supports toggling between exponential regression and linear logarithmic regression. It also provides offset bands around the curve for additional insights.
Key Inputs
1. yxlogreg and dlogreg:
These are the "Endwert" (end value) and "Startwert" (start value) for calculating the slope of the logarithmic regression.
2. bars:
Specifies how many historical bars are considered in the calculation.
3.offsetchannel:
Adds an adjustable percentage-based offset to create upper and lower bands around the main exponential curve.
Default: 1 (interpreted as 10% bands).
4.lineareregression log.:
A toggle to switch between exponential function and linear logarithmic regression.
Default: false (exponential is used by default).
5.Dynamic Labels:
Creates a label showing the calculated regression values and historical bars count at the latest bar. The label is updated dynamically.
Use Cases
Exponential Growth Tracking:
Useful for assets or instruments exhibiting exponential growth trends.
Identifying Channels:
Helps identify support and resistance levels using the offset bands.
Switching Analysis Modes:
Flexibility to toggle between exponential and linear logarithmic analysis.
نص برمجي مفتوح المصدر
بروح TradingView الحقيقية، قام مبتكر هذا النص البرمجي بجعله مفتوح المصدر، بحيث يمكن للمتداولين مراجعة وظائفه والتحقق منها. شكرا للمؤلف! بينما يمكنك استخدامه مجانًا، تذكر أن إعادة نشر الكود يخضع لقواعد الموقع الخاصة بنا.
إخلاء المسؤولية
لا يُقصد بالمعلومات والمنشورات أن تكون، أو تشكل، أي نصيحة مالية أو استثمارية أو تجارية أو أنواع أخرى من النصائح أو التوصيات المقدمة أو المعتمدة من TradingView. اقرأ المزيد في شروط الاستخدام.