OPEN-SOURCE SCRIPT
MA Direction Histogram
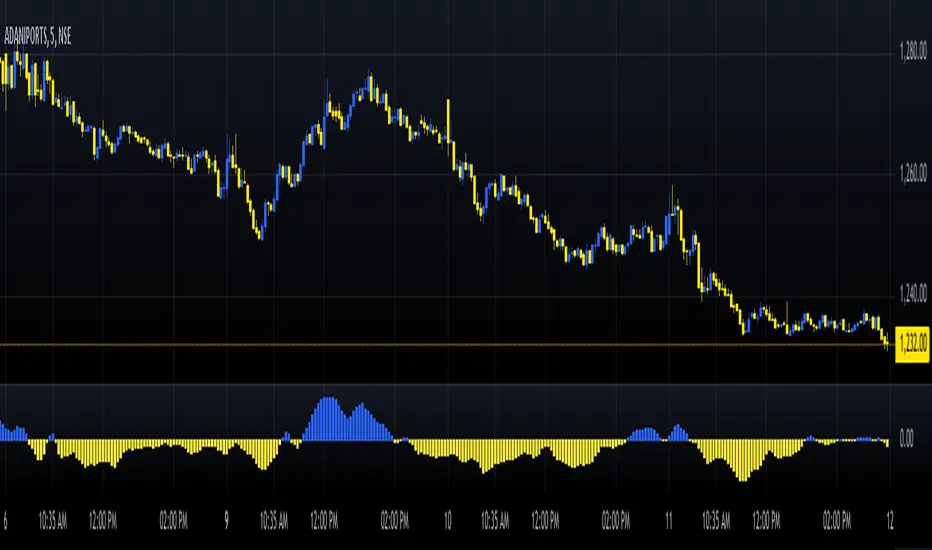
The MA Direction Histogram is a simple yet powerful tool for visualizing the momentum of a moving average (MA). It highlights whether the MA is trending up or down, making it ideal for identifying market direction quickly.
Key Features:
1. Custom MA Options: Choose from SMA, EMA, WMA, VWMA, or HMA for flexible analysis.
2. Momentum Visualization: Bars show the difference between the MA and its value from a lookback period.
- Blue Bars: Upward momentum.
- Yellow Bars: Downward momentum.
3. Easy Customization: Adjust the MA length, lookback period, and data source.
How to Use:
- Confirm Trends: Positive bars indicate uptrends; negative bars suggest downtrends.
- *Spot Reversals: Look for bar color changes as potential reversal signals.
Compact, intuitive, and versatile, the "MA Direction Histogram" helps traders stay aligned with market momentum. Perfect for trend-based strategies!
نص برمجي مفتوح المصدر
بروح TradingView الحقيقية، قام مبتكر هذا النص البرمجي بجعله مفتوح المصدر، بحيث يمكن للمتداولين مراجعة وظائفه والتحقق منها. شكرا للمؤلف! بينما يمكنك استخدامه مجانًا، تذكر أن إعادة نشر الكود يخضع لقواعد الموقع الخاصة بنا.
إخلاء المسؤولية
لا يُقصد بالمعلومات والمنشورات أن تكون، أو تشكل، أي نصيحة مالية أو استثمارية أو تجارية أو أنواع أخرى من النصائح أو التوصيات المقدمة أو المعتمدة من TradingView. اقرأ المزيد في شروط الاستخدام.