OPEN-SOURCE SCRIPT
CHK 3TIMEFRAME RSI OB-OS SCREENER
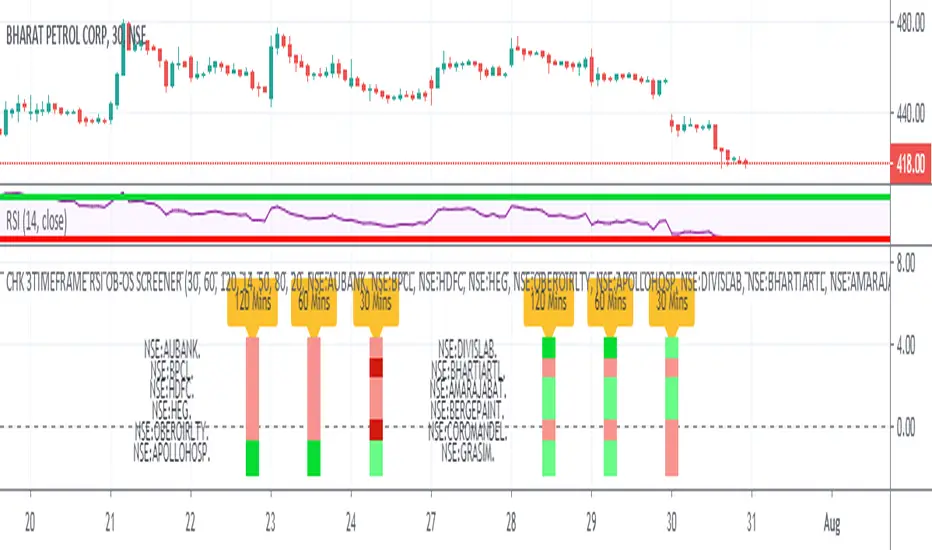
Sharing RSI Screener. It shows RSI Situation for 12 Stocks.
User can replace the stocks as per their respective exchange
User can select 3 Time Frames of his/her choice
User can change the OverBought / OverSold Values to 70/30. This indicator uses 80/20.
RSI BELOW 50 = PINK COLOR
OVERSOLD = MAROON COLOR
RSI ABOVE 50 = LIGHT GREEN COLOR
OVERBOUGHT = DARK GREEN COLOR
For Example : This Chart and the Indicator snapshot shows, the stock BPCL is Oversold for the 30 Min TimeFrame
For Example : The indicator snapshot shows, the stocks HDFC and AUBANK have their RSI's below 50 across the 30 Min / 60 Min / 120 Min
TimeFrames
Please give it some time to load, and every time you change Resolution.
Add another one, to have a screener screening 24 stocks :)
نص برمجي مفتوح المصدر
بروح TradingView الحقيقية، قام مبتكر هذا النص البرمجي بجعله مفتوح المصدر، بحيث يمكن للمتداولين مراجعة وظائفه والتحقق منها. شكرا للمؤلف! بينما يمكنك استخدامه مجانًا، تذكر أن إعادة نشر الكود يخضع لقواعد الموقع الخاصة بنا.
إخلاء المسؤولية
لا يُقصد بالمعلومات والمنشورات أن تكون، أو تشكل، أي نصيحة مالية أو استثمارية أو تجارية أو أنواع أخرى من النصائح أو التوصيات المقدمة أو المعتمدة من TradingView. اقرأ المزيد في شروط الاستخدام.