OPEN-SOURCE SCRIPT
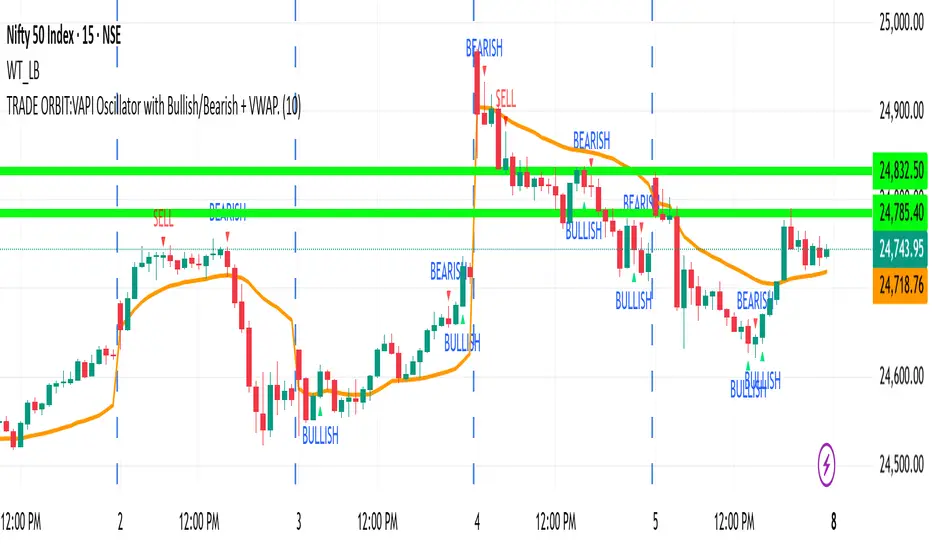
TRADE ORBIT:VAPI Oscillator with Bullish/Bearish + VWAP.
Components
VAPI Oscillator
Shows the balance of buying vs. selling pressure using price and volume.
Plotted as a histogram (green above zero, red below zero) with a gray oscillator line.
Zero line (gray) acts as the main threshold between bullish and bearish pressure.
Signals
Bullish Signal (▲ BULLISH) → Triggered when VAPI crosses above zero.
Bearish Signal (▼ BEARISH) → Triggered when VAPI crosses below zero.
Alerts are included for automation/notifications.
VWAP (Volume Weighted Average Price)
Plotted on the main price chart (orange line).
Resets each new trading day.
Acts as an institutional benchmark for trend and fair value.
🔹 How to Use
When VAPI crosses above zero → market pressure is bullish (look for long opportunities, especially if price is above VWAP).
When VAPI crosses below zero → market pressure is bearish (look for short opportunities, especially if price is below VWAP).
VWAP provides a strong support/resistance zone; confluence between VAPI and VWAP strengthens signals.
نص برمجي مفتوح المصدر
بروح TradingView الحقيقية، قام مبتكر هذا النص البرمجي بجعله مفتوح المصدر، بحيث يمكن للمتداولين مراجعة وظائفه والتحقق منها. شكرا للمؤلف! بينما يمكنك استخدامه مجانًا، تذكر أن إعادة نشر الكود يخضع لقواعد الموقع الخاصة بنا.
إخلاء المسؤولية
لا يُقصد بالمعلومات والمنشورات أن تكون، أو تشكل، أي نصيحة مالية أو استثمارية أو تجارية أو أنواع أخرى من النصائح أو التوصيات المقدمة أو المعتمدة من TradingView. اقرأ المزيد في شروط الاستخدام.