OPEN-SOURCE SCRIPT
تم تحديثه DOW Theory Price Action Multi-Time Frame
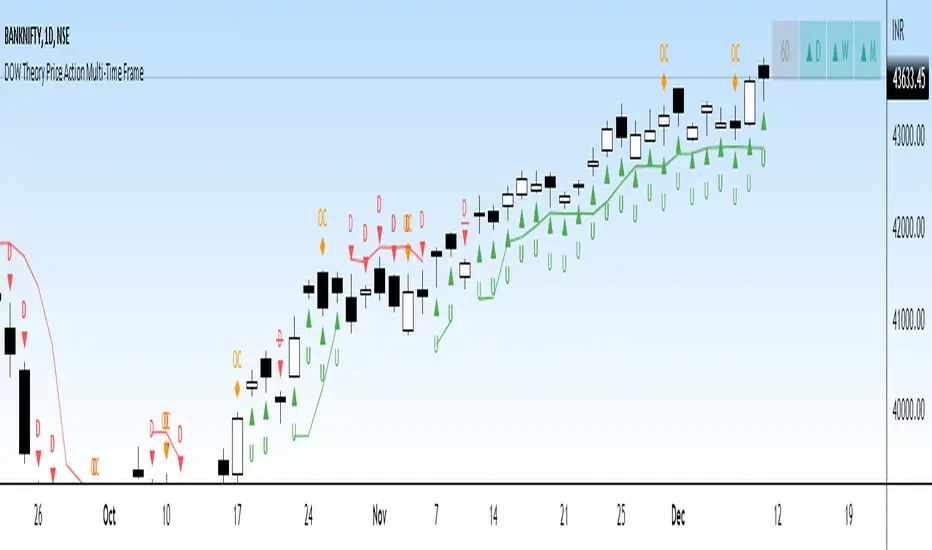
This indicator gives a visual representation of Dow Theory Price action based trend analysis and provides trader a table with 4 different timeframe to align with the trend.
It will help traders identify if it is an ongoing Impulse Wave or a Corrective Wave.
3 rules for Bullish Price Action setup (Uptrend or continuation of existing UpTrend): Denoted by 'U' below the candlestic
HH - Higher High
HL - Higher Low
CAH - Close above prior High
3 rules for Bearish Price Action setup (Downtrend or continuation of existing DownTrend): Denoted by 'D' below the candlestic
LH - Lower High
HL - LowerLow
CAH - Close below prior Low
Exception - Outside Candle: Denoted by 'OC' above the candlestic
Outside reversal is a two-day price pattern that shows when a candle or bar on a candlestick or bar chart falls “outside” of the previous day's candle or bar.
The table posistion can be set be user from the input settings as per his screen setting / resolution.
The trailing line can is also customizable from inputs, recomended value is 3-4.
Ideation Credits: Mr. Vineet Jain
ملاحظات الأخبار
Fixed the code where it the trend was an existing trend was changing without a valid DOW Theory Price action condition becoming true.نص برمجي مفتوح المصدر
بروح TradingView الحقيقية، قام مبتكر هذا النص البرمجي بجعله مفتوح المصدر، بحيث يمكن للمتداولين مراجعة وظائفه والتحقق منها. شكرا للمؤلف! بينما يمكنك استخدامه مجانًا، تذكر أن إعادة نشر الكود يخضع لقواعد الموقع الخاصة بنا.
إخلاء المسؤولية
لا يُقصد بالمعلومات والمنشورات أن تكون، أو تشكل، أي نصيحة مالية أو استثمارية أو تجارية أو أنواع أخرى من النصائح أو التوصيات المقدمة أو المعتمدة من TradingView. اقرأ المزيد في شروط الاستخدام.
نص برمجي مفتوح المصدر
بروح TradingView الحقيقية، قام مبتكر هذا النص البرمجي بجعله مفتوح المصدر، بحيث يمكن للمتداولين مراجعة وظائفه والتحقق منها. شكرا للمؤلف! بينما يمكنك استخدامه مجانًا، تذكر أن إعادة نشر الكود يخضع لقواعد الموقع الخاصة بنا.
إخلاء المسؤولية
لا يُقصد بالمعلومات والمنشورات أن تكون، أو تشكل، أي نصيحة مالية أو استثمارية أو تجارية أو أنواع أخرى من النصائح أو التوصيات المقدمة أو المعتمدة من TradingView. اقرأ المزيد في شروط الاستخدام.