OPEN-SOURCE SCRIPT
Auto Fib Extension and Retracements
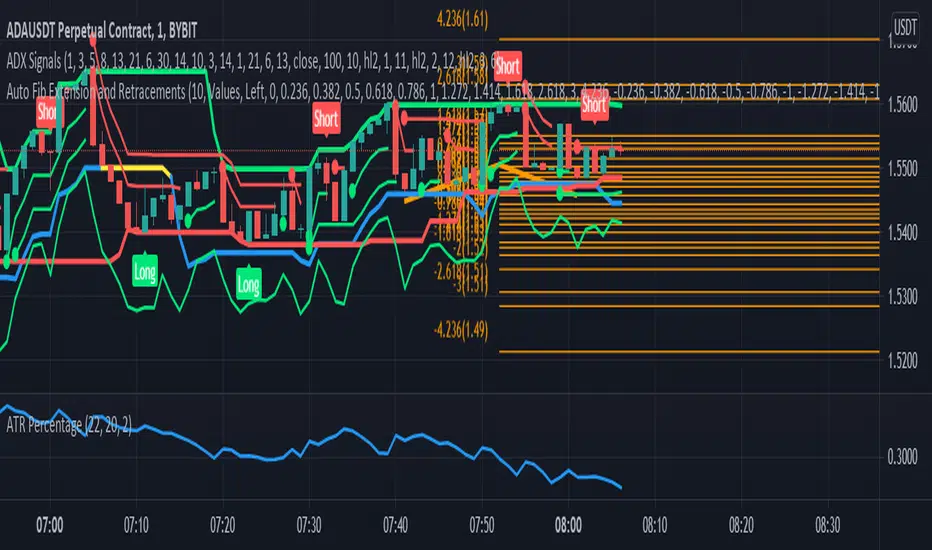
This script is used for plotting the Fibonacci support and resistance levels. Compared to other ones, the changes to this script are that you can choose what color should all the lines be and that it doesn't change the chart's size, meaning that it won't shrink the chart so that all the levels can be seen. If you have any suggestions, I'm open to anything.
Also, if you could give a like/comment or if you could follow me, that would do my day. Thank you all and enjoy!
Also, if you could give a like/comment or if you could follow me, that would do my day. Thank you all and enjoy!
نص برمجي مفتوح المصدر
بروح TradingView الحقيقية، قام مبتكر هذا النص البرمجي بجعله مفتوح المصدر، بحيث يمكن للمتداولين مراجعة وظائفه والتحقق منها. شكرا للمؤلف! بينما يمكنك استخدامه مجانًا، تذكر أن إعادة نشر الكود يخضع لقواعد الموقع الخاصة بنا.
إخلاء المسؤولية
لا يُقصد بالمعلومات والمنشورات أن تكون، أو تشكل، أي نصيحة مالية أو استثمارية أو تجارية أو أنواع أخرى من النصائح أو التوصيات المقدمة أو المعتمدة من TradingView. اقرأ المزيد في شروط الاستخدام.