OPEN-SOURCE SCRIPT
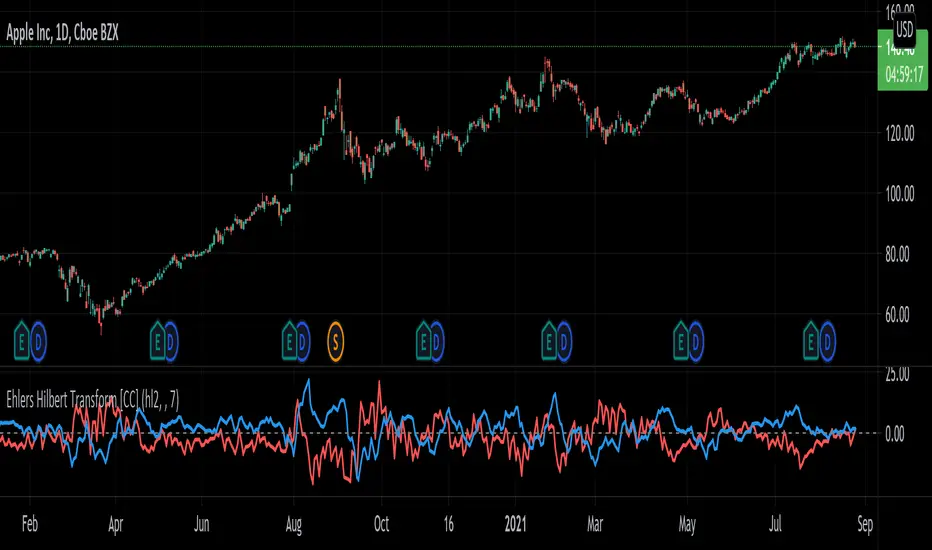
Ehlers Hilbert Transform [CC]

The Hilbert Transform was created by John Ehlers (Stocks & Commodities V. 18:3 (16-27)) and this indicator can work pretty well as a trend confirmation. This essentially transforms the underlying price data into a soundwave and when you compare the two (blue is positive and red is negative) then it provides fairly clear buy and sell signals. Ehlers did warn in his original article that this indicator has a lag of 4 bars so you have to keep that in mind. I have found that this indicator works pretty well when you buy when the blue line goes over the red line and sell when the blue lines hits the zero line. You could also ignore the red line and buy when the blue line crosses over the zero line and sell when it crosses under. Let me know how you wind up using this indicator in your trading.
Let me know if there are any other scripts you would like to see me publish!
Let me know if there are any other scripts you would like to see me publish!
نص برمجي مفتوح المصدر
بروح TradingView الحقيقية، قام مبتكر هذا النص البرمجي بجعله مفتوح المصدر، بحيث يمكن للمتداولين مراجعة وظائفه والتحقق منها. شكرا للمؤلف! بينما يمكنك استخدامه مجانًا، تذكر أن إعادة نشر الكود يخضع لقواعد الموقع الخاصة بنا.
إخلاء المسؤولية
لا يُقصد بالمعلومات والمنشورات أن تكون، أو تشكل، أي نصيحة مالية أو استثمارية أو تجارية أو أنواع أخرى من النصائح أو التوصيات المقدمة أو المعتمدة من TradingView. اقرأ المزيد في شروط الاستخدام.