PROTECTED SOURCE SCRIPT
تم تحديثه Higher Timeframe Candle Overlay
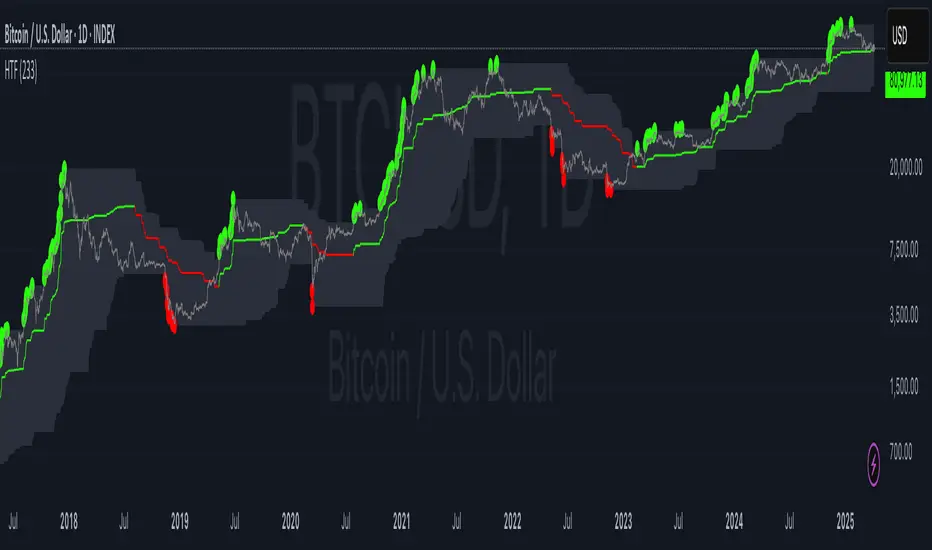
Hi all, this script helps you to see candle of any timeframe at the same time. It is possible to find the regions of dying trend by peeking into the higher timeframe candles. For example, on a 1-min chart, a 1439 min ( (24*60) - 1 ) candle is a day candle refernce to that 1-min. If huge bodied candles starts to grow larger wicks and smaller bodies, it means that the trend is dying.
ملاحظات الأخبار
- Optimised code
- Cleaned up charting
ملاحظات الأخبار
Added colouring inputDisplayed higher timeframe candle's Bullish Highs, Bearish Lows and Median price levels
ملاحظات الأخبار
- Displayed HTF Candles based areas of lower and higher prices
ملاحظات الأخبار
- Fixed typos
ملاحظات الأخبار
Updated to PineScript v6ملاحظات الأخبار
+Added colours for median lineنص برمجي محمي
تم نشر هذا النص البرمجي كمصدر مغلق. ومع ذلك، يمكنك استخدامه بحرية ودون أي قيود - تعرف على المزيد هنا.
إخلاء المسؤولية
لا يُقصد بالمعلومات والمنشورات أن تكون، أو تشكل، أي نصيحة مالية أو استثمارية أو تجارية أو أنواع أخرى من النصائح أو التوصيات المقدمة أو المعتمدة من TradingView. اقرأ المزيد في شروط الاستخدام.
نص برمجي محمي
تم نشر هذا النص البرمجي كمصدر مغلق. ومع ذلك، يمكنك استخدامه بحرية ودون أي قيود - تعرف على المزيد هنا.
إخلاء المسؤولية
لا يُقصد بالمعلومات والمنشورات أن تكون، أو تشكل، أي نصيحة مالية أو استثمارية أو تجارية أو أنواع أخرى من النصائح أو التوصيات المقدمة أو المعتمدة من TradingView. اقرأ المزيد في شروط الاستخدام.