Smart Sizing
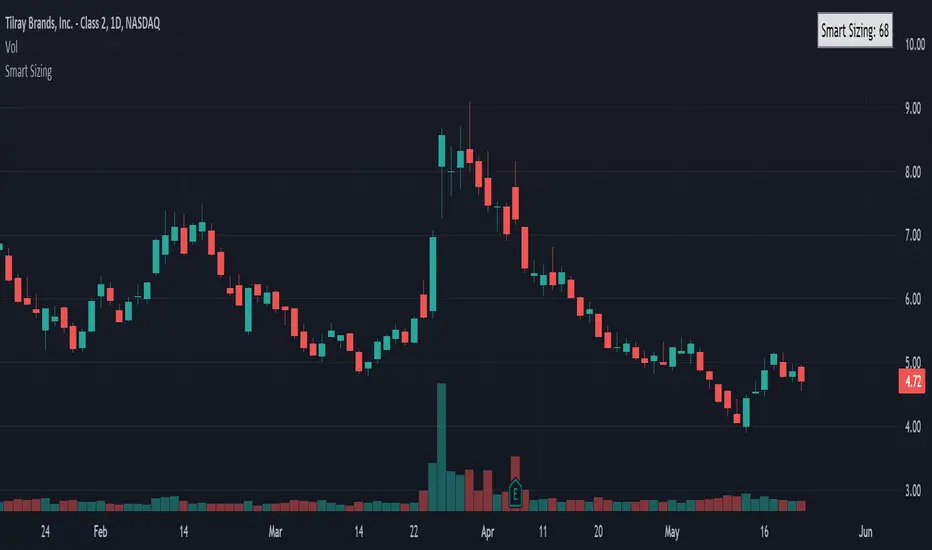
That's what the Smart Sizing indicator does, it tells you directly on the chart in a small table and right next to the indicator a value that is how many shares to trade according to your account value and risk objectives. You simply enter in your account value in the indicator settings (I update mine everyday), what % of your account you want to risk, and what ATR Length and Timeframe you wish to use. For example, if you entered your account value at $10,000 with risk percentage at 1% and if you used the daily ATR which was 0.50 then it would show as 200 shares (10,000 x 0.01) / 0.50 = 200 and by trading 200 shares that means if the stock went against you by 1 daily ATR it would equal 1% of your account. So if you used a ATR trailing stop or a fixed stop based on the ATR this indicator can help you determine what your correct position size should be so you can practice good risk management.
Take the example below of two stocks with an almost identical price, Citigroup $C with a last traded price of $50.03 and Exelon
Please note this indicator is designed for stocks but could also be used for forex but shouldn't be used for futures. It can be used on any timeframe with stocks worldwide.
Jared.
Disclaimer: All my scripts and content are for educational purposes only. I'm not a financial advisor and do not give personal finance advice. Past performance is no guarantee of future performance. Please trade at your own risk.
نص برمجي للمستخدمين المدعوين فقط
يمكن فقط للمستخدمين الذين تمت الموافقة عليهم من قبل المؤلف الوصول إلى هذا البرنامج النصي. ستحتاج إلى طلب الإذن والحصول عليه لاستخدامه. يتم منح هذا عادةً بعد الدفع. لمزيد من التفاصيل، اتبع تعليمات المؤلف أدناه أو اتصل ب Click-Capital مباشرة.
لا توصي TradingView بالدفع مقابل برنامج نصي أو استخدامه إلا إذا كنت تثق تمامًا في مؤلفه وتفهم كيفية عمله. يمكنك أيضًا العثور على بدائل مجانية ومفتوحة المصدر في نصوص مجتمعنا.
تعليمات المؤلف
إخلاء المسؤولية
نص برمجي للمستخدمين المدعوين فقط
يمكن فقط للمستخدمين الذين تمت الموافقة عليهم من قبل المؤلف الوصول إلى هذا البرنامج النصي. ستحتاج إلى طلب الإذن والحصول عليه لاستخدامه. يتم منح هذا عادةً بعد الدفع. لمزيد من التفاصيل، اتبع تعليمات المؤلف أدناه أو اتصل ب Click-Capital مباشرة.
لا توصي TradingView بالدفع مقابل برنامج نصي أو استخدامه إلا إذا كنت تثق تمامًا في مؤلفه وتفهم كيفية عمله. يمكنك أيضًا العثور على بدائل مجانية ومفتوحة المصدر في نصوص مجتمعنا.