OPEN-SOURCE SCRIPT
تم تحديثه Realtime Daily High Low Half Quarter Box
Overview
概要
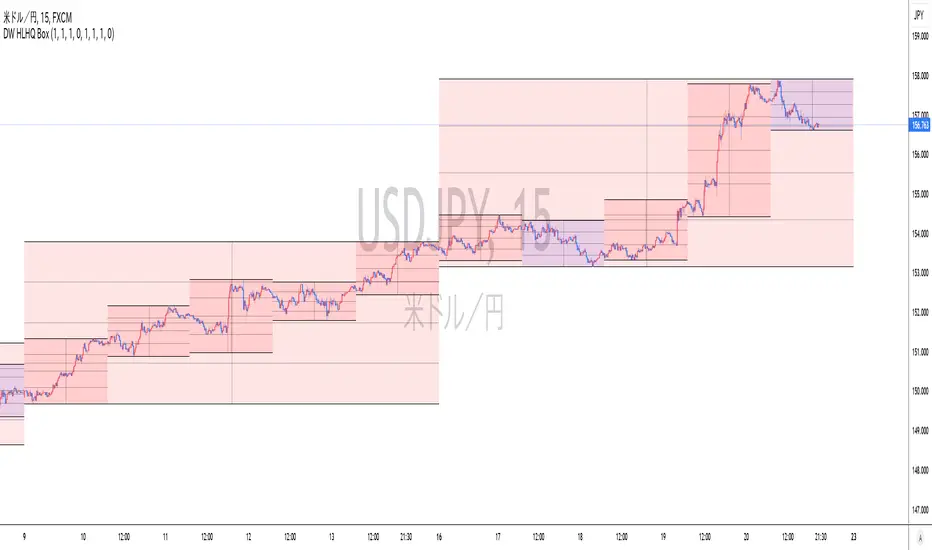
- This indicator offers real-time updates for daily high and low prices, addressing the issue of expanding plots in traditional daily high-low indicators.
- It plots daily high, low, 1/2, and 1/4 price levels as horizontal lines.
- It adds a vertical line at the center of the daily candle.
- You can customize the indicator's background color for bullish and bearish days.
- It extends horizontal lines until the daily candle switches.
- This indicator is not compatible with second-by-second data.
- Due to Pine Script's object drawing limitations, there is a restriction on how many days back the price lines can be drawn.
概要
- このインジケーターは、従来の日足の高値・安値プロットの問題を解決し、リアルタイムでの更新を提供します。これにより、プロットが広がっていく現象が回避されます。
- インジケーターは、日足の高値、安値、1/2、1/4の価格レベルを水平線で表示します。
- 一日の中央の時間に垂直線を追加します。
- 日足が陽線と陰線のいずれかに応じて、背景色をカスタマイズできます。
- インジケーターは日足が切り替わるバーまで水平線を延長します。
- このインジケーターは秒足データには対応していません。
- Pine Scriptのオブジェクト描画数の制限により、価格ラインの描画が遡れる日数に制限があります。
ملاحظات الأخبار
The issue of vertical lines appearing in daily chart display has been fixed.ملاحظات الأخبار
Have made an update to the indicator, adding background colors based on bullish and bearish days even within the intraday boxes.ملاحظات الأخبار
I forgot to update the script page's chart, so I am updating it now.ملاحظات الأخبار
I've updated the script with the following changes:- Added a verification mode. In verification mode, price lines are drawn back to past candles for validation purposes.
- In verification mode, real-time plotting expands as the daily high and low are updated.
- Default background color transparency is set to 90.
There are currently a couple of known issues:
- Sometimes, when the daily candle updates, horizontal lines extend beyond the chart.
- In verification mode, a vertical line for the current day is drawn.
ملاحظات الأخبار
Update Summary- Added weekly price level lines.
Current Identified Issues and Solutions:
- When drawing objects using Pine Script, we can only draw up to 500 bars into the future. This limitation may lead to errors when using short-term timeframes like 1-minute charts.
- If you are using a lower timeframe, please turn off the weekly price level lines checkbox.
- Currently, 1-minute charts are not supported for both daily and weekly lines.
ملاحظات الأخبار
- Added daily and weekly shift inputs to allow rightward line displacement.
- Changed indicator short title.
ملاحظات الأخبار
- Added daily and weekly shift inputs to allow rightward line displacement.
- Changed indicator short title.
ملاحظات الأخبار
- Added daily and weekly shift inputs to allow rightward line displacement.
- Changed indicator short title.
نص برمجي مفتوح المصدر
بروح TradingView الحقيقية، قام مبتكر هذا النص البرمجي بجعله مفتوح المصدر، بحيث يمكن للمتداولين مراجعة وظائفه والتحقق منها. شكرا للمؤلف! بينما يمكنك استخدامه مجانًا، تذكر أن إعادة نشر الكود يخضع لقواعد الموقع الخاصة بنا.
إخلاء المسؤولية
لا يُقصد بالمعلومات والمنشورات أن تكون، أو تشكل، أي نصيحة مالية أو استثمارية أو تجارية أو أنواع أخرى من النصائح أو التوصيات المقدمة أو المعتمدة من TradingView. اقرأ المزيد في شروط الاستخدام.