[PATAlgo] Index Options (v2)
This advanced indicator is engineered to empower traders with real-time insights into market trends and price dynamics. Through sophisticated algorithms and cutting-edge functionalities, it provides a competitive edge, enabling users to stay ahead of market curves and make well-informed trading decisions.
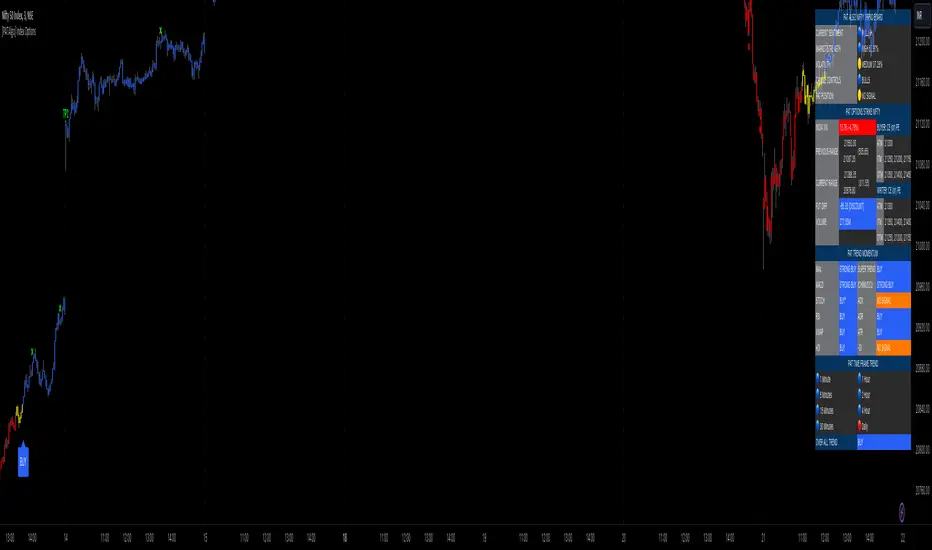
One of the standout features of PATAlgo Index Options is its chart and candle analysis setup, facilitating pattern identification and aiding traders in making prudent decisions. Below, we delve into the core features of this indicator suite, offering a detailed explanation of its functionalities.
1. PAT Signals:
Signal Mode: Tailored to trader styles, accommodating scalpers, swing traders, and positional traders.
Signal Reactivity: Allows customization for signal frequency, with settings ranging from 1.2 to 6.
Signal Strength: Defines signal intensity on a scale from 1 to 10.
2. PAT Trace:
A trend-tracing tool effective across all time frames, particularly beneficial for scalpers and swing traders.
Analyzes historical price data to identify patterns, support/resistance levels, and trend lines.
3. PAT Trends:
An auto-trending indicator based on price action and patterns, offering clarity on market trends and breakouts.
4. PAT Profile:
A powerful volume analysis tool aiding in technical analysis.
Analyzes traded volume at different price levels, identifying support and resistance, tracking market sentiment, and informing trading decisions.
5. PAT S/R:
Auto support and resistance analysis tool, eliminating the need for manual analysis.
Provides traders with key levels for making informed trading decisions.
6. PAT Auto FIB:
Automatically plots Fibonacci retracement levels on a price chart.
Simplifies the identification of potential support and resistance areas based on Fibonacci ratios.
7. PAT Blocks:
Represents significant buying or selling activity on a particular price level.
Identifies price rejections or consolidations, indicating potential imbalances between supply and demand.
8. PAT Zone:
Identifies key support and resistance zones on a price chart.
Indicates areas where buying and selling pressure is concentrated based on historical price action.
نص برمجي للمستخدمين المدعوين فقط
يمكن فقط للمستخدمين الذين تمت الموافقة عليهم من قبل المؤلف الوصول إلى هذا البرنامج النصي. ستحتاج إلى طلب الإذن والحصول عليه لاستخدامه. يتم منح هذا عادةً بعد الدفع. لمزيد من التفاصيل، اتبع تعليمات المؤلف أدناه أو اتصل ب PAT_CLUB مباشرة.
تجدر الإشارة إلى أن هذا النص البرمجي الخاص والموجه بدعوة فقط لم تتم مراجعته من قبل المشرفين على النص البرمجي، كما أن امتثاله للقواعد الداخلية غير محدد. لا توصي TradingView بالدفع مقابل برنامج نصي أو استخدامه إلا إذا كنت تثق تمامًا في مؤلفه وتفهم كيفية عمله. يمكنك أيضًا العثور على بدائل مجانية ومفتوحة المصدر في نصوص مجتمعنا.
تعليمات المؤلف
إخلاء المسؤولية
نص برمجي للمستخدمين المدعوين فقط
يمكن فقط للمستخدمين الذين تمت الموافقة عليهم من قبل المؤلف الوصول إلى هذا البرنامج النصي. ستحتاج إلى طلب الإذن والحصول عليه لاستخدامه. يتم منح هذا عادةً بعد الدفع. لمزيد من التفاصيل، اتبع تعليمات المؤلف أدناه أو اتصل ب PAT_CLUB مباشرة.
تجدر الإشارة إلى أن هذا النص البرمجي الخاص والموجه بدعوة فقط لم تتم مراجعته من قبل المشرفين على النص البرمجي، كما أن امتثاله للقواعد الداخلية غير محدد. لا توصي TradingView بالدفع مقابل برنامج نصي أو استخدامه إلا إذا كنت تثق تمامًا في مؤلفه وتفهم كيفية عمله. يمكنك أيضًا العثور على بدائل مجانية ومفتوحة المصدر في نصوص مجتمعنا.