OPEN-SOURCE SCRIPT
Delta Volume Heatmap
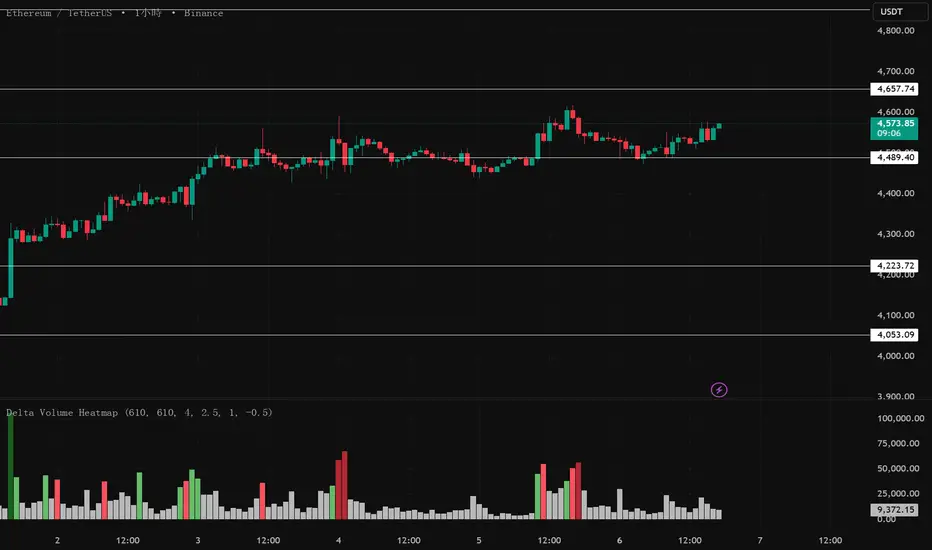
🔥 Delta Volume Heatmap
The Delta Volume Heatmap visualizes the real-time strength of per-bar delta volume — highlighting the imbalance between buying and selling pressure.
Each column’s color intensity reflects how strong the delta volume deviates from its moving average and standard deviation.
🟩 Green tones = Buy-dominant activity (bullish imbalance)
🟥 Red tones = Sell-dominant activity (bearish imbalance)
This tool helps traders quickly identify:
Abnormal volume spikes
Absorption or exhaustion zones
Potential reversal or continuation signals
نص برمجي مفتوح المصدر
بروح TradingView الحقيقية، قام مبتكر هذا النص البرمجي بجعله مفتوح المصدر، بحيث يمكن للمتداولين مراجعة وظائفه والتحقق منها. شكرا للمؤلف! بينما يمكنك استخدامه مجانًا، تذكر أن إعادة نشر الكود يخضع لقواعد الموقع الخاصة بنا.
إخلاء المسؤولية
لا يُقصد بالمعلومات والمنشورات أن تكون، أو تشكل، أي نصيحة مالية أو استثمارية أو تجارية أو أنواع أخرى من النصائح أو التوصيات المقدمة أو المعتمدة من TradingView. اقرأ المزيد في شروط الاستخدام.